Table of Contents
UNITED STATES |
SECURITIES AND EXCHANGE COMMISSION |
Washington, D.C. 20549 |
|
SCHEDULE 14A |
|
Proxy Statement Pursuant to Section 14(a) of
the Securities Exchange Act of 1934 (Amendment No. ) |
|
Filed by the Registrant x |
|
Filed by a Party other than the Registrant o |
|
Check the appropriate box: |
o | Preliminary Proxy Statement |
o | Confidential, for Use of the Commission Only (as permitted by Rule 14a-6(e)(2)) |
x | Definitive Proxy Statement |
o | Definitive Additional Materials |
o | Soliciting Material Pursuant to §240.14a-12 |
|
West Pharmaceutical Services, Inc. |
(Name of Registrant as Specified In Its Charter) |
|
|
(Name of Person(s) Filing Proxy Statement, if other than the Registrant) |
|
Payment of Filing Fee (Check the appropriate box): |
x | No fee required. |
o | Fee computed on table below per Exchange Act Rules 14a-6(i)(1) and 0-11. |
| (1) | Title of each class of securities to which transaction applies: |
| | |
| (2) | Aggregate number of securities to which transaction applies: |
| | |
| (3) | Per unit price or other underlying value of transaction computed pursuant to Exchange Act Rule 0-11 (set forth the amount on which the filing fee is calculated and state how it was determined): |
| | |
| (4) | Proposed maximum aggregate value of transaction: |
| | |
| (5) | Total fee paid: |
| | |
o | Fee paid previously with preliminary materials. |
o | Check box if any part of the fee is offset as provided by Exchange Act Rule 0-11(a)(2) and identify the filing for which the offsetting fee was paid previously. Identify the previous filing by registration statement number, or the Form or Schedule and the date of its filing. |
| (1) | Amount Previously Paid: |
| | |
| (2) | Form, Schedule or Registration Statement No.: |
| | |
| (3) | Filing Party: |
| | |
| (4) | Date Filed: |
| | |
| | |
| | Persons who are to respond to the collection of information contained in this form are not required to respond unless the form displays a currently valid OMB control number. |
| | | |
Table of Contents
West Pharmaceutical Services, Inc.
Notice of 2016
West Pharmaceutical Services, Inc. Notice of 2017 Annual Meeting |
530 Herman O. West Drive
Exton, Pennsylvania 19341
March 23, 201622, 2017
The 20162017 Annual Meeting of Shareholders of West Pharmaceutical Services, Inc. will be held at our corporate headquarters on:
Tuesday, May 3, 20162, 2017
9:30 AM, local time
530 Herman O. West Drive
Exton, Pennsylvania 19341
The items of business are:
1.Election of nominees named in the Proxy Statement as directors, each for a term of one year. 2.Consideration of an advisory vote to approve named executive officer compensation.
3.Approval of the adoption of the West Pharmaceutical Services, Inc. 2016 Omnibus Incentive Compensation Plan.
4.Ratification of the appointment of PricewaterhouseCoopers LLP as our independent registered public accounting firm for the 2016 Year.
5.Transaction of other business as may properly come before the meeting and any adjournments or postponements thereof.
| Election of nominees named in the Proxy Statement as directors, each for a term of one year. |
| |
2. | Consideration of an advisory vote to approve named executive officer compensation. |
| |
3. | Consideration of an advisory vote on the frequency of the executive compensation vote. |
| |
4. | Ratification of the appointment of PricewaterhouseCoopers LLP (“PwC”) as our independent registered public accounting firm for the 2017 Year. |
| |
5. | Transaction of other business as may properly come before the meeting and any adjournments or postponements thereof. |
Shareholders of record of West common stock at the close of business on March 8, 2016,7, 2017 are entitled to notice of, and to vote at, the meeting and any postponements or adjournments thereof.
| George L. Miller |
| Sr. Vice President, General Counsel and |
| Corporate Secretary |
Important Notice Regarding the Internet Availability of Proxy Materials for the Shareholder Meeting on May 3, 20162, 2017
This Notice of Annual Meeting and Proxy Statement (“Notice”) and the 20152016 Annual Report (“20152016 Annual Report”) are available on our website at:
www.westpharma.com/na/en/Investors/Pages/ProxyMaterials.aspxhttp://investor.westpharma.com/phoenix.zhtml?c=118197&p=irol-reportsannual
Your Vote is Important
Please vote as promptly as possible electronically via the Internet or by completing, signing, dating and returning the proxy card or voting instruction card.
Table of Contents

| GENERAL INFORMATION | 
|
Below is a summary of important information you will find in this Proxy Statement. This summary does not contain all of the information that you should consider, and you should read the entire Proxy Statement carefully before voting.
Summary of Shareholder Voting Matters
|
| | | | |
Recommended
|
| | | | | | |
Proposal 1: Election of Directors | | | | Page 61
57 | | ü FOR |
Mark A. Buthman
William F. Feehery
Eric M. Green
Thomas W. Hofmann
Paula A. Johnson
| Myla P. Lai-Goldman
Douglas A. Michels
Paolo Pucci
John H. Weiland
Patrick J. Zenner
|
| | | Each Nominee |
| | | | | |
|
Proposal 2: Advisory Vote to Approve Named Executive Officer Compensation |
| Page
63 | |
Page 67
|
ü FOR |
| | | | | |
|
Proposal 3: ApprovalAdvisory Vote on Frequency of the Adoption of the West Pharmaceutical Services, Inc. 2016 Omnibus IncentiveExecutive Compensation PlanVote |
| Page
64 | |
Page 68
|
ü FOR EVERY ONE YEAR |
| | | | | |
|
Proposal 4: Ratification of the Appointment of PricewaterhouseCoopers LLP as our Independent Registered Public Accounting Firm for the 20162017 Year | | Page 65 | |
Page 76
|
ü FOR |
|
|
|
| | | |
2016 Annual Meeting and Proxy Statement | 1
Table of Contents
| GENERAL INFORMATION
| 
| |
Our Director Nominees
You are being asked to vote on the directors nominated below. All directors are elected annually by a majority of votes cast, except in the case of a contested election where the number of nominees exceeds the number of open positions. Detailed information about each director’s background and areas of expertise can be found beginning on page 62.58. All directors, except Mr. Green, are independent.
| | | | | | | | Current Committee
Memberships | | Other
Current |
Name | | Age | | Director
Since | | Current Occupation | | AC | | CC | | NCGC | | ITC | | Public
Boards |
| | | | | | | | | | | | | | | | |
Mark A. Buthman | | 55 | | 2011 | | Retired EVP & CFO, Kimberly-Clark | | C | | | | M | | | | — |
William F. Feehery | | 45 | | 2012 | | President, Industrial Biosciences, E.I. Du Pont de Nemours and Company | | | | | | | | C | | — |
Eric M. Green | | 46 | | 2015 | | President & CEO, West Pharmaceutical Services, Inc. | | | | | | | | | | — |
Thomas W. Hofmann | | 64 | | 2007 | | Retired Sr. VP & CFO, Sunoco, Inc. | | M | | M | | | | | | 3 |
Paula A. Johnson | | 56 | | 2005 | | Cardiologist; Exec. Dir. of Connors Center for Women’s Health and Gender Biology Brigham and Women’s Hospital | | M | | | | | | M | | — |
Myla P. Lai-Goldman | | 58 | | 2014 | | CEO and President of GeneCentric Diagnostics, Inc. | | | | | | | | M | | 1 |
Douglas A. Michels | | 59 | | 2011 | | President & CEO, OraSure Technologies, Inc. | | M | | M | | | | | | 1 |
John H. Weiland | | 60 | | 2007 | | President & Chief Operating Officer, C. R. Bard, Inc. | | | | C | | | | | | 1 |
Patrick J. Zenner | | 69 | | 2002 | | Chairman, West; Retired CEO & Pres., Hoffmann-La Roche Inc. | | | | | | C | | | | 1 |
| | | | | | | | | | | | | | | | | | | | | | |
| |
| |
| |
| |
| |
|
M
| | Member
| | AC
| | Audit Committee
| | CC
| | Compensation Committee
|
| |
| |
| |
| |
| |
|
C
| | Chair
| | ITC
| | Innovation and Technology Committee
| | NCGC
| | Nominating and Corporate Governance Committee
|
| | | | Director | | | | Current Committee
Memberships | | Other
Current
Public |
Name | | Age | | Since | | Current Occupation | | AC | | CC | | FC | | ITC | | NCGC | | Boards |
Mark A. Buthman | | 56 | | 2011 | | Retired EVP & CFO, Kimberly-Clark | | C | | | | | | | | M | | 1 |
William F. Feehery | | 46 | | 2012 | | President, Industrial Biosciences, E.I. Du Pont de Nemours and Company | | M | | | | | | | | C | | — |
Eric M. Green | | 47 | | 2015 | | President & CEO, West Pharmaceutical Services, Inc. | | | | | | | | | | | | — |
Thomas W. Hofmann | | 65 | | 2007 | | Retired Sr. VP & CFO, Sunoco, Inc. | | M | | M | | M | | | | | | — |
Paula A. Johnson | | 57 | | 2005 | | President, Wellesley College | | | | | | | | C | | | | — |
Myla P. Lai-Goldman | | 59 | | 2014 | | CEO and President of GeneCentric Diagnostics, Inc. | | | | | | M | | M | | | | 1 |
Douglas A. Michels | | 60 | | 2011 | | President & CEO, OraSure Technologies, Inc. | | | | C | | | | M | | | | 1 |
Paolo Pucci | | 55 | | 2016 | | CEO, ArQule, Inc. | | M | | M | | | | | | | | 2 |
John H. Weiland | | 61 | | 2007 | | Vice Chairman, President & Chief Operating Officer, C. R. Bard, Inc. | | | | M | | C | | | | | | 1 |
Patrick J. Zenner | | 70 | | 2002 | | Chairman, West; Retired CEO & Pres., Hoffmann-La Roche Inc. | | | | | | | | | | M | | 1 |
2015LEGEND: M — Member; C — Chairperson; AC — Audit Committee; CC — Compensation Committee; ITC — Innovation and Technology Committee; FC — Finance Committee; NCGC — Nominating and Corporate Governance Committee
2017 Annual Meeting and Proxy Statement
2016 Performance and Compensation Highlights
We believe that Mr. Green and the other named executive officers (“NEOs”) performed well in 20152016 and that their compensation is appropriate in relation to that performance. Under their leadership, our Company achieved a total shareholder return (“TSR”) of 14%42% in 20152016 and a cumulative three-year TSR of 126%77%. Those returns reflect our growing sales and profitability. Compared to 2014:2015: net sales grew 7.2%9.1% (at constant currency exchange rates), gross margin grew by 1100.6 margin points to 32.6%33.2%, adjusted operating margin grew 701.2 margin points to 13.6%14.8% and adjusted diluted earnings per share (“Adjusted Diluted EPS”) increased 19%21.3% (at constant currency exchange rates).


(1) 2015 reported net sales decreased 1.5% versus 2014; unfavorable foreign currency translation reduced sales growth by 8.7%. See page 2625 of our 20152016 Form 10-K Annual Report for discussion of the impact of foreign currency rates on reported net sales.
(2) Below is a reconciliation of adjusted dilutedAdjusted Diluted EPS growth at constant currency exchange rates:
| | 2015 | | 2014 | | Change | | 2016 | | 2015 | |
US GAAP Diluted EPS | | $ 1.30 | | $ 1.75 | | -25.7% | | $ | 1.91 | | $ | 1.30 | |
Pension settlement charge | | 0.43 | | | | | | — | | 0.43 | |
Executive retirement and related costs | | 0.09 | | | | | | — | | 0.09 | |
License costs | | | | 0.01 | | | |
Restructuring-related charges | | | 0.23 | | — | |
Venezuela currency devaluation | | | 0.04 | | — | |
Pension curtailment gain | | | (0.01 | ) | — | |
Discrete tax charges | | 0.01 | | 0.02 | | | | 0.01 | | 0.01 | |
Adjusted diluted EPS | | $ 1.83 | | $ 1.78 | | 2.8% | |
Adjusted Diluted EPS | | | $ | 2.18 | | $ | 1.83 | |
Impact of foreign exchange rates | | 0.29 | | | | | | 0.04 | | | |
Adjusted Diluted EPS at Constant Exchange rates | | $ 2.12 | | $ 1.78 | | 19.1% | |
Adjusted Diluted EPS at constant currency exchange rates | | | $ | 2.22 | | $ | 1.83 | |
(3) Gross margin and adjusted operating margin are discussed on page 2726 and page 3129 of our 20152016 Form 10-K.
2016 Annual Meeting and Proxy Statement | 2
Table of Contents
GENERAL INFORMATION
| 
|
The following table shows the components of 20152016 compensation paid to our named executive officers, including total “realizable” pay. Realizable pay takes a retrospective look at pay and performance. Realizable pay is the sum of: (1) base salary paid; (2) annual incentive plan amounts actually earned for 20152016 performance; (3) the in-the-money value of stock option grants made in 2015;2016; (4) the current accrued estimate for payouts for the Performance-VestingPerformance Share Unit award made in 20152016 (at 98.5%91.29% of target); and, (5) the 20152016 year end value of any time-vesting restricted stock granted in 2015.2016. The table is not a substitute for our 20152016 Summary Compensation Table set forth on page 45.41.
20152016 Summary Compensation and Realizable CompensationPay
(all amounts in U.S. Dollars)
Name and
Current Principal Position | | Salary | | Bonus | | Stock
Awards | | Option
Awards | | Non-Equity
Incentive Plan
Compensation | | Change in
Pension Value
and
Nonqualified
Deferred
Compensation
Earnings | | All Other
Compen-
sation | | SEC
Total | | SEC
Total
Without
Change in
Pension
Value (1) | | Total
Realizable
Compensation | | | Salary | | Bonus | | Stock
Awards | | Option
Awards | | Non-Equity
Incentive Plan
Compensation | | Change in
Pension Value
and
Nonqualified
Deferred
Compensation
Earnings | | All Other
Compensation | | SEC
Total | | SEC
Total
Without
Change in
Pension (1) | | Total
Realizable
Pay | |
Eric M. Green
President & CEO | | 473,846 | | 616,667 | | 3,174,950 | | 3,175,106 | | 614,259 | | 42,927 | | 267,697 | | 8,365,452 | | 8,322,525 | | 5,788,906 | | | 749,039 | | —0- | | 1,026,285 | | 1,000,020 | | 738,575 | | 70,066 | | 64,142 | | 3,648,127 | | 3,578,061 | | 4,970,851 | |
William J. Federici
Sr. VP & CFO | | 515,483 | | -0- | | 350,015 | | 350,006 | | 447,210 | | 119,960 | | 24,388 | | 1,807,062 | | 1,687,102 | | 1,554,856 | | |
William J. Federici
Sr. VP, CFO & Treasurer | | | 517,264 | | —0- | | 350,027 | | 350,005 | | 375,244 | | 249,457 | | 21,616 | | 1,863,613 | | 1,614,156 | | 2,111,679 | |
Karen A. Flynn
Sr. VP & CCO | | 425,526 | | -0- | | 312,512 | | 326,744 | | 359,630 | | 19,334 | | 33,191 | | 1,476,937 | | 1,457,603 | | 1,304,692 | | | 439,881 | | —0- | | 350,027 | | 350,005 | | 309,960 | | 91,642 | | 27,162 | | 1,568,677 | | 1,477,035 | | 1,969,012 | |
John E. Paproski
Sr. VP & CTO | | 374,196 | | -0- | | 299,990 | | 299,994 | | 272,580 | | 112,865 | | 30,706 | | 1,390,331 | | 1,277,466 | | 1,154,311 | | |
George L. Miller
Sr. VP, GC & Corp. Secretary | | 41,538 | | 66,667 | | 700,065 | | 299,988 | | -0- | | 2,769 | | 13,403 | | 1,124,430 | | 1,121,661 | | 768,951 | | | 400,000 | | —0- | | 299,989 | | 300,011 | | 247,780 | | 27,468 | | 239,945 | | 1,515,193 | | 1,487,725 | | 1,692,754 | |
Donald E. Morel, Jr.
Former Chairman & CEO | | 461,857 | | -0- | | 1,199,991 | | 1,200,030 | | 537,413 | | 965,793 | | 242,107 | | 4,607,191 | | 3,641,398 | | 2,445,128 | | |
Annette F. Favorite
Sr. VP & CHRO | | | 300,000 | | 150,000 | | 158,702 | | 150,028 | | 171,540 | | 28,912 | | 181,709 | | 1,140,891 | | 1,111,979 | | 1,144,077 | |
(1) This column is each officer’s total compensation, as determined under applicable SEC rules, minus the change in pension value reported in the Change in Pension Value and Nonqualified Deferred Compensation Earnings column of the Summary Compensation Table. It shows the impact that change in pension values had on total compensation, as determined under applicable SEC rules, which vary substantially due to actuarial calculations. The amounts reported in the SEC Total Without Change in Pension Value column may differ substantially from the amounts reported in the Total column of the Summary Compensation Table required under SEC rules and are not a substitute for total compensation underas described in the 20152016 Summary Compensation Table.Table on page 41.
Key 20152016 Compensation-Related Actions
· Reaffirmed compensation philosophy to target our executive compensation at the median (50th percentile) of comparator group companies.
· Revised our annual incentive plan metrics to more closely align with our market-led enterprise strategy and revised market-led organizational design.
· Thoroughly reviewed our Talent Market and Business Segment comparator groups to ensure alignment with our renewed enterprise strategic plan, adjusted in the members of the Business Segment group and the selection criteria for the Talent Market group and confirmed the appropriate usage of the two groups.
·Conducted formal pay-for-performance review of CEO compensation versus peers.
·Conductedpeers and realizable pay analysis to assess whether Company performance and CEO realizable pay are aligned over a given period of time.period.
· Evaluated compensation packagespackage for outgoing Chairman and CEO, new President and CEO and new Senior Vice President, General CounselGlobal Operations and Supply Chain and Vice President of Corporate Secretary.
2016 Annual MeetingStrategy and Proxy Statement | 3Investor Relations.
Table of Contents
GENERAL INFORMATION
| 
|
Other Existing Key Compensation Features
· Clawback of incentive compensation
· No “single trigger” feature on parachute payments in change-in-control agreements offered to future executives
· No-hedging/no-pledging of company stock
· Independent compensation consultant
· Share ownership requirements
· Annual compensation risk assessment
· Limited perquisites and personal benefits
Auditors
Set forth below is summary information with respect to PricewaterhouseCoopers LLP’sPwC’s fees for services provided in 20152016 and 2014.2015.
Type of Fees | | 2015 | | 2014 | |
| | | | | |
Audit Fees | | $1,869,280 | | $1,657,566 | |
Audit-Related Fees | | 25,510 | | 17,500 | |
Tax Fees | | 315,374 | | 159,505 | |
All Other Fees | | 5,000 | | 11,366 | |
Total | | $2,215,164 | | $1,845,937 | |
2016 Annual Meeting and Proxy Statement | 4
Type of Fees | | 2016 | | 2015 | |
| | | | | |
Audit Fees | | $ | 1,935,280 | | $ | 1,869,280 | |
Audit-Related Fees | | 1,500 | | 25,510 | |
Tax Fees | | 224,014 | | 315,374 | |
All Other Fees | | 8,600 | | 5,000 | |
Total | | $ | 2,169,394 | | $ | 2,215,164 | |
Table of Contents
GENERAL INFORMATION
| 
|
General Information About the Meeting |
Proxy Solicitation
Our Board of Directors is soliciting your vote on matters that will be presented at our 2016
Our Board of Directors is soliciting your vote on matters that will be presented at our 2017 Annual Meeting of Shareholders and at any adjournment or postponement. This Proxy Statement contains information on these matters to assist you in voting your shares. The Notice, the accompanying proxy card or voting instruction card and our 2016 Form 10-K, including our annual report wrapper, are being mailed starting on or about March 22, 2017. | | The Notice, the accompanying proxy card or voting instruction card and our 2015 Form 10-K, including our annual report wrapper, are being mailed starting on or about March 23, 2016.
|
Shareholders Entitled to Vote
All shareholders of record of our common stock, par value $.25 per share, at the close of business on March 8, 2016,All shareholders of record of our common stock, par value $.25 per share, at the close of business on March 7, 2017, are entitled to receive the Notice and to vote their shares at the meeting. As of that date, 73,326,840 shares of our common stock were outstanding. Each share is entitled to one vote on each matter properly brought to the meeting.
| | As of that date, 72,712,473 shares of our common stock were outstanding. Each share is entitled to one vote on each matter properly brought to the meeting.
|
You may vote at the Annual Meeting by delivering a proxy card in person or you may cast your vote in any of the following ways:
 
|
|  
| 
|
| | 
|
Mailing your signed proxy card or votervoting instruction card. | | Using the Internet at www.ProxyVote.com. | | Calling toll-free from the United States, U.S. territories and Canada to 1-800-690-6903. |
How Your Shares Will Be Voted
In each case, for registered shareholders, your shares will be voted as you instruct. If you return a signed card, but do not provide voting instructions, your shares will be voted FOR each of the proposals. You may revoke or change your vote any time before the proxy is exercised by filing with our Corporate Secretary a notice of revocation or a duly executed proxy bearing a later date. You may also vote in person at the meeting, although attendance at the meeting will not by itself revoke a previously granted proxy. If you hold shares in the Company in “Street name” or through a broker, please refer to “Broker Voting” on the next page. Plan Participants. Any shares you may hold in the West Pharmaceutical Services, Inc. 401(k) Plan or the Tech Group Puerto Rico Savings and Retirement Plan have been added to your other holdings on your proxy card. Your completed proxy card serves as voting instructions to the trustee of those plans. You may direct the trustee how to vote your plan shares by submitting your proxy vote for those shares, along with the rest of your shares, by Internet, phone or mail, all as described on the enclosed proxy card. If you do not instruct the trustee how to vote, your plan shares will be voted by the trustee in the same proportion that it votes shares in other plan accounts for which it received timely voting instructions. Deadline for Voting. The deadline for voting by telephone or Internet is 11:59 PM Eastern Time on May 1, 2017. If you are a registered shareholder and attend the meeting, you may deliver your completed proxy card in person. “Street name” shareholders who wish to vote at the meeting will need to obtain a proxy form from the institution that holds their shares. Broker Voting If your shares are held in a stock brokerage account or by a bank or other holder of record, you are considered the “beneficial owner” of shares held in “Street name.” The Notice would have been made available to you by your broker, bank or other holder of record who is considered the shareholder of record of those shares. As the beneficial owner, you may direct your broker, bank or other holder of record on how to vote your shares by using the proxy card included in the materials made available to you or by following their instructions for voting instructions, your shares will be voted FOR each of the proposals. You may revoke or change your vote any time before the proxy is exercised by filing with our Corporate Secretary a notice of revocation or a duly executed proxy bearing a later date. You may also vote in person at the meeting, although attendance at the meeting will not by itself revoke a previously granted proxy. If you hold shares in the Company in “Street name” or through a broker, please refer to | | “Broker Voting” on the next page.
Plan Participants. Any shares you may hold in the West Pharmaceutical Services, Inc. 401(k) Plan or the Tech Group Puerto Rico Savings and Retirement Plan have been added to your other holdings on your proxy card. Your completed proxy card serves as voting instructions to the trustee of those plans. You may direct the trustee how to vote your plan shares by submitting your proxy vote for those shares, along with the rest of your shares, by Internet, phone or mail, all as described on the enclosed
|
2016 Annual Meeting and Proxy Statement | 5
Table of Contents
GENERAL INFORMATION
| 
|
proxy card. If you do not instruct the trustee how to vote, your plan shares will be voted by the trustee in the same proportion that it votes shares in other plan accounts for which it received timely voting instructions.
Deadline for Voting. The deadline for voting by telephone or Internet is 11:59 PM Eastern Time
| | on May 2, 2016. If you are a registered shareholder and attend the meeting, you may deliver your completed proxy card in person. “Street name” shareholders who wish to vote at the meeting will need to obtain a proxy form from the institution that holds their shares.
|
If your shares are held in a stock brokerage account or by a bank or other holder of record, you are considered the “beneficial owner” of shares held in street name. The Notice would have been made available to you by your broker, bank or other holder of record who is considered the shareholder of record of those shares. As the beneficial owner, you may direct your broker, bank or other holder of record on how to vote your shares by using the proxy card included in the materials made available to you or by following their instructions for voting on the
| | Internet. A broker non-vote occurs when a broker or other nominee that holds shares for another does not vote on a particular item because the nominee does not have discretionary voting authority for that item and has not received instructions from the owner of the shares. Although there is no controlling precedent under Pennsylvania law regarding the treatment of broker non-votes in certain circumstances, we intend to apply the principles outlined in the table below: |
Proposal | | Votes Required | | Treatment of Abstentions and
Broker Non-Votes | | Broker
Discretionary
Voting |
Proposal 1 - Election of Directors | | The number of shares voted “for” a director must exceed the number of votes cast “against” that director.director | | Abstentions and broker non-votes will not be taken into account in determining the outcome of the proposal | | No |
Proposal 2 - Advisory Vote to Approve Named Executive Officer Compensation | | Majority of the shares present and entitled to vote on the proposal in person or represented by proxy | | Abstentions will have the effect of negative votes and broker non-votes will not be taken into account in determining the outcome of the proposal | | No |
Proposal 3 - ApprovalAdvisory Vote on Frequency of the adoption of the West Pharmaceutical Services, Inc. 2016 Omnibus IncentiveExecutive Compensation PlanVote | | MajorityPlurality of the shares present and entitled to vote on the proposal in person or represented by proxyvotes cast
| | Abstentions will have the effect of negative votes and broker non-votes will not be taken into account in determining the outcome of the proposal | | No |
Proposal 4 - Ratification of the Appointment of PricewaterhouseCoopers LLCLLP as our Independent Registered Public Accounting Firm for the 20162017 Year | | Majority of the shares present and entitled to vote on the proposal in person or represented by proxy | | Abstentions and broker non-votes will have the effect of negative votes | | Yes |
2016 Annual Meeting and Proxy Statement | 6
Table of Contents
GENERAL INFORMATION
| 
|
Quorum
We must have a quorum to conduct business at the 2016 Annual Meeting. A quorum consists of the presence at the meeting either in person or represented by proxy of the holders of a majority of the outstanding shares of our common stock entitled to vote. For the purpose of establishing
| | We must have a quorum to conduct business at the 2017 Annual Meeting. A quorum consists of the presence at the meeting either in person or represented by proxy of the holders of a majority of the outstanding shares of our common stock entitled to vote. For the purpose of establishing a quorum, abstentions, including brokers holding customers’ shares of record who cause abstentions to be recorded at the meeting, and broker non-votes are considered shareholders who are present and entitled to vote, and count toward the quorum. |
Mailings to Multiple Shareholders at the Same Address
We have adopted a procedure called “householding” for making the Proxy Statement and the Annual Report available. Householding means that shareholders who share the same last name and address will receive only one copy of the materials, unless we are notified that one or more of these shareholders wishes to continue receiving additional copies. We will continue to make a proxy card available to each shareholder of record. If you prefer to receive multiple copies of the proxy materials at the same address, please contact us in writing or by telephone: Corporate Secretary, West Pharmaceutical Services, Inc., 530 Herman O. West Drive, Exton, PA 19341, (610) 594-3319. | | We will continue to make a proxy card available to each shareholder of record. If you prefer to receive multiple copies of the proxy materials at the same address, please contact us in writing or by telephone: Corporate Secretary, West Pharmaceutical Services, Inc., 530 Herman O. West Drive, Exton, PA 19341, (610) 594-3319.
|
Electronic Availability of Proxy Statement and Annual Report
We are pleased to be distributing our proxy materials to certain shareholders via the Internet under the “notice and access” approach permitted by the rules of the SEC. This method conserves natural resources and reduces our costs of printing and mailing while providing a convenient way for shareholders to review our materials and vote their shares.
| | On March 23, 2016,
We are pleased to be distributing our proxy materials to certain shareholders via the Internet under the “notice and access” approach permitted by the rules of the SEC. This method conserves natural resources and reduces our costs of printing and mailing while providing a convenient way for shareholders to review our materials and vote their shares. On March 22, 2017, we mailed a “Notice of Internet Availability” to participating shareholders, which contains instructions on how to access the proxy materials on the Internet. If you would like to receive a printed copy of our proxy materials, we will send you one free of charge. Instructions for requesting such materials are included in the Notice. |
This Proxy Statement and our 20152016 Annual Report are available at:
www.westpharma.com/na/en/Investors/Pages/ProxyMaterials.aspx http://investor.westpharma.com/phoenix.zhtml?c=118197&p=irol-reportsannual
Proxy Solicitation Costs
We pay the cost of soliciting proxies. Proxies will be solicited on behalf of the Board by mail, telephone, and other electronic means or in person. We have retained Georgeson Inc., 199 Water Street, 26th Floor, New York, NY 10038, to help with the solicitation for a fee of $8,500, plus reasonable out-of-pocket costs and expenses. We will reimburse brokerage firms and other custodians, nominees and fiduciaries their reasonable out-of-pocket expenses for forwarding solicitation materials to shareholders and obtaining their votes.
CORPORATE GOVERNANCE AND BOARD MATTERS
Corporate Governance and Board Matters
During 2016, our Board met six times. Each director attended at least 75% of the Board meetings and the meetings of the Board committees on which he or she served except for Paula Johnson who attended 40% of our Audit Committee meetings, 67% of our ITC Committee meetings and 67% of our Board meetings. All directors are expected to attend the 2017 Annual Meeting, and Proxy Statement | 7all our directors attended the 2016 Annual Meeting.
TableOur principal governance documents are our Corporate Governance Principles, Board Committee Charters, director qualification standards and Code of ContentsBusiness Conduct. Aspects of our governance documents are summarized below. We encourage our shareholders to read our governance documents, as they present a comprehensive picture of how the Board addresses its governance responsibilities to ensure our vitality and success. The documents are available in the “Investors — Corporate Governance” section of our website at www.westpharma.com and copies of these documents may be requested by writing to our Corporate Secretary, West Pharmaceutical Services, Inc., 530 Herman O. West Drive, Exton, PA 19341.
CORPORATE GOVERNANCE AND BOARD MATTERS
| 
|
We pay the cost of soliciting proxies. Proxies will be solicited on behalf of the Board by mail, telephone, and other electronic means or in person. We have retained Georgeson Inc., 199 Water Street, 26th Floor, New York, NY 10038, to help with the solicitation for a fee of $8,500,
| | plus reasonable out-of-pocket costs and expenses. We will reimburse brokerage firms and other custodians, nominees and fiduciaries their reasonable out-of-pocket expenses for forwarding solicitation materials to shareholders and obtaining their votes.
|
Corporate Governance and Board Matters
|
During 2015, our Board met seven times. Each director attended at least 75% of the Board meetings and the meetings of the Board committees on which he or she served. All directors are expected to attend the 2016 Annual Meeting, and all of our directors attended the 2015 Annual Meeting.
Our principal governance documents are our Corporate Governance Principles, Board Committee Charters, director qualification standards and Code of Business Conduct. Aspects of our governance documents are
| | summarized below. We encourage our shareholders to read our governance documents, as they present a comprehensive picture of how the Board addresses its governance responsibilities to ensure our vitality and success. The documents are available in the “Investors — Corporate Governance” section of our website at www.westpharma.com and copies of these documents may be requested by writing to our Corporate Secretary, West Pharmaceutical Services, Inc., 530 Herman O. West Drive, Exton, PA 19341.
|
Corporate Governance Principles
Our Board has adopted Corporate Governance Principles to provide guidance to our Board and its committees on their respective roles, director qualifications and responsibilities, Board and committee composition, organization and leadership. During 2016, we significantly updated our Corporate Governance Principles to meet best practices in corporate governance and ensure the Corporate Governance Principles address our current and long-term business needs. Our revised Corporate Governance Principles to provide guidance to our Board and its committees on their respective roles, director qualifications and responsibilities, Board and committee composition, organization and leadership. Our Principles address, among other things: · Director qualification standards, including our independence standards;
· The requirement to hold separate executive sessions of the independent directors;
· The role of independent directors in executive succession planning;
| | · The Board’s policy on setting director compensation and director share-ownership guidelines;
· Guidelines on Board organization and leadership, including the number and structure of committees and qualifications of committee members;
· Guidelines on outside board memberships;
· Policies on access to management;
· Director orientation and education; and
· Self-assessments of board and committee performance to determine their effectiveness.
|
2016 Annual Meeting and Proxy Statement | 8
Table· Statements of Contents
CORPORATE GOVERNANCE AND BOARD MATTERS
| 
|
the Board’s commitment to high ethical standards, principles of fair dealing and high ethical standards;
· The requirement to hold separate executive sessions of the independent directors;
· The importance of robust executive succession planning and the role of directors in succession planning;
· The Board’s policy on setting director compensation and director share-ownership guidelines;
· Guidelines on Board organization and leadership, including the number and structure of committees and qualifications of committee members;
· Guidelines on outside board memberships;
· Policies on making charitable contributions and prohibition of political contributions;
· Policies on access to Management;
· Requirements fostering leadership development by senior executives;
· Statements of our executive compensation philosophy and our independent auditor standards;
· Director orientation and education; and
· Self-assessments of Board and Committee performance to determine their effectiveness.
Code of Business Conduct
All of our employees, officers and directors are required to comply with our Code of Business Conduct as a condition of employment. The Code of Business Conduct covers fundamental ethical and compliance-related principles and practices such as accurate accounting records and financial reporting, avoiding conflicts of interest, protection and proper use of our
property and information and compliance with legal and regulatory requirements. In 2016, we substantially updated and enhanced our Code of Business Conduct. The Board has adopted a comprehensive Compliance and Ethics Program and has named Mr. Miller our Compliance Officer. Our Compliance Officer delivers regular reports on program developments and initiatives to the Audit Committee and the Board.
Board Leadership Structure
The current governance structure of the Board follows:
· The offices of Chairman and CEO are separate;
· The Board has established and follows robust corporate governance guidelines;
· All of the members of the Board, other than Mr. Green, are independent;
· The Audit, Compensation, Nominating and Corporate Governance and Innovation and TechnologyAll Board Committees are each composed solely of independent directors;
· Our independent directors meet regularly in executive session both at the Board and Board committee levels; and
· Our directors as a group possess a broad range of skills and experience sufficient to provide the leadership and strategic direction the Company requires as it seeks to enhance long-term value for shareholders.
Dr. Morel, the CEO prior to Mr. Green, served as both Chairman and CEO, whereas Mr. Green currently serves as President and CEO and Mr. Zenner serves as Chairman. The Board does not currently have a lead independent director, although the Board believes it may be useful and
appropriate to designate a lead independent director ifWhile the offices of Chairman and CEO are combined incurrently separate, the future.
The Board takes a flexible approach to the issue of whether the offices of Chairman and CEO should be separate or combined. This approach allows the Board to regularly evaluate whether it is in the best interests of the Company for the CEO or another director to hold the position of Chairman.
With the retirement of Dr. Morel and appointment of Mr. Green,The Board does not currently have a lead independent director, although the Board reassessedbelieves it may be useful and appropriate to designate a lead independent director if the combinationoffices of Chairman and CEO are combined in the CEO and Chairman positions. Effective upon Dr. Morel’s retirement as CEO, the Board determined that separating the positions is currently the best leadership structure for the Company.future.
We believe the current Board leadership structure is appropriate at this timenow because it allows the Chairman to focus on corporate governance and management of the Board priorities and allows the CEO to focus directly on managing our operations and growing the Company.
During previous CEO transitions, the Board has twice separated the CEO and Chairman roles. This approach has been successful in enabling the CEO to develop strategy in consultation with the Board and ensure the effective implementation of that strategy.
2016 Annual Meeting and Proxy Statement | 9
Table of Contents
CORPORATE GOVERNANCE AND BOARD MATTERS
| 
|
Chairman of the Board of Directors
Upon Dr. Morel’s stepping down as CEO on April 24, 2015, he was named Chairman through June 30, 2015 to aid in the transition to Mr. Green as the new CEO. Upon Dr. Morel’s retirement as Chairman on June 30, 2015, Patrick J. Zenner, an independent director who is the Chairman of the Nominating and Corporate Governance Committee and previously served as the Chairman, Independent Directors, was appointed by the Board effective in July 2015 to serve as the Chairman of the Board until the 2016 Annual Meeting of Shareholders. The responsibilities of the Chairman include:
· Chairing Board meetings, including executive sessions of the independent directors;
· Approving agendas and schedules for each Board meeting in consultation with the CEO; and,
· Serving as principal liaison between the CEO and the independent directors.
Each independent director may add items to the agenda. Independent directors meet in regularly scheduled executive sessions and in special executive sessions called by the Chairman.
The Board has fourfive standing committees:
· Audit Committee;
· Compensation Committee;
· Finance Committee;
· Innovation and Technology Committee; and,
·Nominating and Corporate Governance Committee; and,
·Innovation and Technology Committee.
The Finance Committee was added in 2016 to review proposals made by Management regarding the optimal capital structure and spending of the Company, analyze, oversee and approve potential opportunities for business combinations, acquisitions, divestitures and similar strategic transactions and to ensure all transactions are in alignment with the Company’s strategic plan. From time to time, the Board may form ad hoc committees to address specific situations as they may arise. During 2014, the Board established one ad hoc committee, the Succession Planning
Committee. The Succession Planning Committee was dissolved upon the appointment of Mr. Green as CEO on April 24, 2015. Each committee consists solely of independent directors. Each standing committee has a written charter, which is posted in the “Investors—Corporate Governance” section of our website at www.westpharma.com.
You may request a printed copy of each standing committee’s charter from our Corporate Secretary.
Audit Committee
Audit Committee
|
| | |
Mark A. Buthman (Chair)
William F. Feehery
Thomas W. Hofmann
Paula A. Johnson
Douglas A. MichelsPaolo Pucci | | The Audit Committee assists our Board in its oversight of: (1) the integrity of our financial statements; (2) the independence and qualifications of our independent auditors; (3) the performance of our internal audit function and independent auditors; and (4) our compliance with legal and regulatory requirements. In carrying out these responsibilities, the Audit Committee, among other things: · Reviews and discusses our annual and quarterly financial statements with managementManagement and the independent auditors; · Manages our relationship with the independent auditors, including having sole authority for their appointment, retention and compensation; reviewing the scope of their work; approving non-audit and audit services; and confirming their independence; and · Oversees management’sManagement’s implementation and maintenance of disclosure controls and procedures and internal control over financial reporting. |
2016 Annual Meeting and Proxy Statement | 10
Table of Contents
CORPORATE GOVERNANCE AND BOARD MATTERS
|
|
| | The Board has determined that Mr. Buthman and Mr. Hofmann are each an “audit committee“Audit Committee financial expert” as defined in SEC regulations. In 2015,2016, the Audit Committee met seven times. All members of the Audit Committee are |
| | independent as defined in the listing standards of the New York Stock Exchange (“NYSE”) and the Company’s Corporate Governance Principles. |
| | |
Compensation Committee | | |
| | |
John H. WeilandDouglas A. Michels (Chair)
Thomas W. Hofmann
Douglas A. MichelsPaolo Pucci
John H. Weiland
| | The Compensation Committee develops our overall compensation philosophy, and, either as a committee or together with the other independent directors, determines and approves our executive compensation programs, makes all decisions about the compensation of our executive officers and oversees our cash and equity-based incentive compensation plans. Additional information about the roles and responsibilities of the Compensation Committee can be found under the heading “Compensation Discussion and Analysis.” In 2015,2016, the Compensation Committee met sevensix times. All members of the Compensation Committee are independent as defined in the listing standards of the NYSE and the Company’s Corporate Governance Principles. |
| | |
NominatingFinance Committee
| | |
| | |
John H. Weiland (Chair)
Thomas W. Hofmann
Myla P. Lai-Goldman | | The Finance Committee reviews proposals made by Management and recommends to the full Board optimal capital structure of the Company and adjustments and the way capital is allocated and deployed by the Company. The Finance Committee analyzes and makes recommendations to the full Board with respect to potential opportunities for business combinations, acquisitions, mergers, disposition, divestitures and similar strategic transactions involving the Company. The Finance Committee also ensures all strategic transactions are in alignment with the Company’s strategic business plan and oversees the process of reviewing, negotiating, consummating and/or integrating potential strategic transactions. In 2016, the Finance Committee met three times. All members of the Finance Committee are independent as defined in the listing standards of the NYSE and the Company’s Corporate Governance Principles. |
| | |
Innovation and Technology Committee |
| | |
Patrick J. ZennerPaula A. Johnson (Chair)
Myla P. Lai-Goldman
Douglas A. Michels
| | The Innovation and Technology Committee provides guidance to our Board on technical and commercial innovation strategies, reviews emerging technology trends that may affect our business, reviews our major innovation and technological programs and overall patent strategies, and assists our Board in making well-informed choices about investments in new technology. In 2016, the Innovation and Technology Committee met three times. |
| | |
Nominating and Corporate Governance Committee |
|
William F. Feehery (Chair)
Mark A. Buthman
Anthony WeltersPatrick J. Zenner | | The Nominating and Corporate Governance Committee identifies qualified individuals to serve as board members; recommends nominees for director and officer positions; determines the appropriate size and composition of our Board and its committees; monitors a process to assess Board effectiveness; reviews related-party transactions; and considers matters of corporate governance. The Committee also reviews and makes recommendations to the Board regarding compensation for non-employee directors and administers director equity-based compensation plans. In 2015,2016, the Nominating and Corporate Governance Committee met fivefour times. All members of the Committee are independent as defined in the listing standards of the NYSE and the Company’s Corporate Governance Principles. |
| | |
Innovation and Technology Committee
|
| | |
William F. Feehery (Chair)
Paula A. Johnson
Myla P. Lai-Goldman
| | The Innovation and Technology Committee provides guidance to our Board on technical and commercial innovation strategies, reviews emerging technology trends that may affect our business, reviews our major innovation and technological programs and overall patent strategies, and assists our Board in making well-informed choices about investments in new technology. In 2015, the Innovation and Technology Committee met three times.
|
| | |
Succession Planning Committee (Ad Hoc)
|
| | |
Patrick J. Zenner (Chair)
Thomas W. Hofmann
Myla P. Lai-Goldman
John H. Weiland
| | The Succession Planning Committee was an ad hoc committee formed in 2014 to provide guidance to our Board on succession planning for the impending retirement of Dr. Morel, announced in October 2014. Dr. Morel’s retirement as CEO occurred in April 2015, and he remained Chairman through June 30, 2015. In 2015, the Succession Planning Committee met four times. This Committee was dissolved upon the appointment of Mr. Green as CEO.
|
2016 Annual Meeting and Proxy Statement | 11
During 2015,2016, our Board and each of its Committees played pivotal roles in helping to develop and approve our corporate strategy. The major issues debated and decided by the Board during 20152016 included:
· Selecting Mr. Green as successor to Dr. Morel;
· Separating the CEO and Chairman roles;
· ApprovingReviewing our progress on our revised enterprise strategic plan;
· Establishment of a new Finance Committee to assist with corporate strategy and strategic partnerships;
·Reviewing the hiring of: (1) a new Senior Vice President of Operations and approving our executiveGlobal Supply Chain, and board compensation strategies;(2) a new Vice President of Corporate Strategy and Investor Relations;
· Reviewing potential targets for mergers and acquisitions and potential licensing opportunities.opportunities;
· Continuation of a strategic share buyback program; and
· Substantial updates to our Corporate Governance Principles and Code of Business Conduct.
The Board’s Role in Risk Oversight
The Board’s role in risk oversight is consistent with our leadership structure, with managementManagement having day-to-day responsibility for assessing and managing our risk exposure and the Board actively overseeing managementManagement of our risks—both at the Board and committee level.
The Board regularly reviews and monitors the risks associated with our financial condition and operations and specifically reviews the enterprise risks associated with our five-year plan. In particular, the Board reviews our risk portfolio, confirms that managementManagement has established risk-management processes that are functioning effectively and efficiently and are consistent with our corporate strategy, reviews the most significant risks and determines whether managementManagement is responding appropriately.
The Board performs its risk oversight role by using several different levels of review. Each Board meeting begins with a strategic overview by the CEO that describes the most significant issues, including risks, affecting the Company and also includes business updates from each reportable segment. In addition, the Board reviews in detail the business and operations of each reportable segment quarterly, including the primary risks associated with that segment.
The Board focuses on the overall risks affecting West. Each committee has been delegated the responsibility for the oversight of specific risks that fall within its areas of responsibility. For example:
· The Compensation Committee is responsible for overseeing the management of risks relating to our executive compensation policies, plans and arrangements and the extent to which those policies or practices increase or decrease risk for the Company.
· The Audit Committee oversees management of financial reporting, compliance and litigation risks as well as the steps managementManagement has taken to monitor and control such exposures.
· The Finance Committee assesses the risks associated with allocation of our capital, potential acquisitions, divestitures and major business partnerships.
· The Innovation and Technology Committee reviews risks associated with intellectual property, innovation efforts and our technology strategy.
· The Nominating and Corporate Governance Committee manages risks associated with the independence of the Board, potential conflicts of interest and the effectiveness of the Board.
· The Innovation and Technology Committee reviews risks associated with intellectual property, innovation efforts and our technology strategy.
· The ad hoc Succession Planning Committee reviewed risks associated with choosing a new Chief Executive Officer and ensuring an effective transition from Dr. Morel to his successor.
Although each committee is responsible for evaluating certain risks and overseeing the management of those risks, the full Board is regularly informed about those risks through committee reports.
2016 Annual Meeting and Proxy Statement | 12
Our Board has adopted a formal set of categorical director qualificationindependence determination standards (“Standards”) used to determine director independence.. The Standards meet or exceed the independence requirements of the NYSE corporate governance listing standards. Under the Standards, a director must have no material relationship with us other than as a director. The Standards specify the criteria for determining director independence, including strict guidelines for directors and their immediate families regarding employment or affiliation with us, members of our senior managementManagement or their affiliates. The full text of the Standards may be found under the “Investors — Corporate Governance
Governance” section on our website at www.westpharma.com.
The Board undertook its annual review of director independence in February 2016.2017. As a result of this review, the Board did not substantively revise the Standards. Subsequently, the Board considered whether any relationships described under the Standards between the Company and each individual director existed. As a result of the review, the Board affirmatively determined that each of its non-employee directors is independent of the Company and its managementManagement team as defined under the Standards.
Executive Sessions of Independent Directors
Our Board also holds regular executive sessions of only independent directors to review the Company’s strategy and management’sManagement’s operating plans, the criteria by which our CEO and other senior executives are measured,
management’s Management’s performance against those criteria and other related issues and to conduct a self-assessment of its performance. Last year, our independent directors held sevensix executive sessions.
Director Mandatory Retirement
A non-employee director must retire on the date of the annual meetingAnnual Meeting of shareholdersShareholders immediately following his or her 72nd birthday.
An employee director must submit his or her resignation upon the date he or she ceases to be an executive of the Company.
Director Education
The Board believes shareholders are best served by Board members who are well versed in corporate governance principles and other subject matters relevant to board service. Therefore, all directors are encouraged to attend any director education programs they consider appropriate to stay informed about developments in corporate governance and the markets we serve. The Company reimburses directors for the reasonable costs of attending director education programs. To encourage continuing director education, the Board also arranges for a series of annual educational presentations on its calendar.
Share Ownership Goals for Directors and Executive Management
To encourage significant share ownership by our directors and further align their interests with the interests of our shareholders, directors are expected to acquire within three years of appointment, and to retain during their Board tenure, shares of our common stock equal in
value to at least five times their annual retainer. All directors meet this requirement or are within the three-year period to obtain the necessary shares. The Board has also set share ownership goals for senior executive management,Management, which are set forth indescribed under “Compensation Discussion and Analysis — Other Compensation Policies.”
2016 Annual Meeting and Proxy Statement | 13
Communicating with the Board
You may communicate with the Chairman of the Board or the independent directors as a group by sending a letter addressed to the Board of Directors, c/o Corporate Secretary,, West Pharmaceutical Services, Inc., 530 Herman O. West Drive, Exton, Pennsylvania 19341. Communications to a particular director should be addressed to that director at the same address.
Our Corporate Secretary maintains a log of all communications received through this process. Communications to specific directors are forwarded to those directors. All other communications are given directly to the Chairman of the Board who decides whether they should be forwarded to a particular Board committee or to managementManagement for further handling.
Nomination of Director Candidates
Candidates for nomination to our Board are selected by the Nominating and Corporate Governance Committee in accordance with the Committee’s charter, our Amended and Restated Articles of Incorporation, our Bylaws and our Corporate Governance Principles. All persons recommended for nomination to our Board, regardless of the source of the recommendation, are evaluated by the Committee.
The Board and the Nominating and Corporate Governance Committee consider, at a minimum, the following factors in recommending potential new Board members or the continued service of existing members:
· A director is nominated based on his or her professional experience. A director’s traits, expertise and experience add to the skill-set of the Board as a whole and provide value in areas needed for the Board to operate effectively.
· A director must have high standards of integrity and commitment, and exhibit independence of judgment, a willingness to ask hard questions of managementManagement and the ability to work well with others.
· A director should be willing and able to devote sufficient time to the affairs of the Company and be free of any disabling conflict.
· All of the non-employee directors should be “independent” as outlined in our Standards.
· A director should exhibit confidence and a willingness to express ideas and engage in constructive discussion with other Board members, Company managementManagement and all relevant persons.
· A director should actively participate in the decision-making process, be willing to make difficult decisions, and demonstrate diligence
and faithfulness in attending Board and committee meetings.
· The Board generally seeks active or former senior-levelsenior executives of public companies, particularly those with international operations, leaders in the healthcare or public health fields, with science or technology backgrounds, and individuals with financial expertise.
When reviewing nominees, the Nominating and Corporate Governance Committee considers whether the candidate possesses the qualifications, experience and skills it considers appropriate in the context of the Board’s overall composition and needs. The Nominating and Corporate Governance Committee also values diversity on the Board in the director nominee identification and nomination process. Our Corporate Governance Principles were revised in 2016 to specifically include a statement of the importance of board diversity to ensure that the director nomination process considers a diverse mix of background, age, gender, sexual orientation, and cultural and ethnic composition.
Accordingly, the Committee’s evaluation of director nominees includes consideration of their ability to contribute to the diversity of personal and professional experiences, opinions, perspectives and backgrounds on the Board. The Committee regularly assesses the effectiveness of this approach as part of its review of the Board’s composition.
To assist it with its evaluation of the director nominees for election at the 20162017 Annual Meeting, the Committee took into accountconsidered the factors listed above and used a skills matrix highlighting the experience of our directors in areas such as industry experience, international background, leadership, financial literacy, risk management expertise and independence.
Under the heading “Director Qualifications and Biographies,” we provide an overview of each
2016 Annual Meeting and Proxy Statement | 14
nominee’s principal occupation, business experience and other directorships of publicly-traded companies, together with the qualifications, experience, key attributes and skills the Committee and the Board believe will best serve the interests of the Board, the Company and our shareholders.
Shareholders who wish to recommend or nominate director candidates must provide information about themselves and their candidates and comply with procedures and timelines contained in our Bylaws. These procedures are described under “Other Information — 20172018 Shareholder Proposals or Nominations” in this Proxy Statement.
Related Person Transactions and Procedures
The Board has adopted written policies and procedures relating to the Nominating and Corporate Governance Committee’s review and approval of transactions with related persons that are required to be disclosed in proxy statements under SEC regulations. A “related person” includes our directors, officers, 5% shareholders and immediate family members of these persons.
Under the policy, the Nominating and Corporate Governance Committee reviews the material facts of all related-person transactions, determines whether the related person has a material interest in the transaction and may approve, ratify, rescind or take other action with respect to the transaction.
In approving a transaction, the Committee will take into account,consider, among other factors, whether
the transaction is on terms no less favorable than terms generally available to an unaffiliated third party under the same or similar circumstances and the extent of the related person’s interest in the transactions.
The Committee reviews and pre-approves certain types of related person transactions, including certain transactions with companies at which the related person is an employee only, and charitable contributions that would not disqualify a director’s independent status. The policy and procedures can be found in the “Investors—Corporate Governance — Related Party Transaction Policies and ProceduresGovernance Documents” section of our website,www.westpharma.com.
We have no related person transactions required to be reported under applicable SEC rules.
DIRECTOR COMPENSATION
Director Compensation
2016 Annual MeetingDirector Compensation
After consulting with Pay Governance LLC, the Board’s independent compensation consultant, the Board approved changes to the compensation structure for our non-employee directors effective January 1, 2016, which was discussed in our 2015 Proxy Statement. This structure increased the restricted stock units granted annually by $30,000 and Proxy Statement | 15increased cash compensation to reflect market trends. The Compensation Committee Chairman fee was increased in recognition of the significant additional duties required of that role. The compensation structure in effect for all of 2016 is set forth below.
Compensation Item | | Amount | |
| | | |
Annual Retainers and Chair Fees | | | |
Board membership | | $ | 80,000 | |
Chairman of the Board | | 100,000 | * |
Audit Committee Chair | | 20,000 | |
Compensation Committee Chair | | 20,000 | |
All Other Committee Chairs | | 10,000 | |
Restricted Stock Units | | 160,000 | |
| | | | |
Table of Contents
DIRECTOR COMPENSATION
| 
|
* Payable in cash or restricted stock, which vests 25% per quarter, as elected annually by the Chairman.
2015 Director Compensation
During 2015, our non-employee directors received annual grants of stock-settled restricted stock units (“RSUs”) equal to $130,000 and a cash annual retainer of $70,000. The following table shows the structure of total 20152016 compensation of our non-employee directors.
Non-Employee Director Compensation Elements (2015)
Compensation Item
| | 2015 Amount
| |
| | | |
Annual Retainers and Chair Fees
| | | |
Board membership
| | $70,000
| |
Chairman, Independent Directors
| | 20,000
| |
Audit Committee Chair
| | 15,000
| |
All Other Committee Chairs
| | 10,000
| |
Restricted Stock Units
| | 130,000
| |
| | | |
Ad Hoc Succession Planning Committee
Due to the importance of attracting and selecting appropriate CEO candidates, the Board approved a special one-time payment to members of the ad hoc Succession Planning Committee when Mr. Green was hired on April 24, 2015. The Chairman of the Committee, Mr. Zenner, received a payment of $15,000 and the other Committee members, Mr. Hofmann, Dr. Lai-Goldman, and Mr. Weiland, received $10,000 each.
Chairman of the Board
In light of the additional duties imposed upon a non-executive Chairman of the Board in May 2015, the Nominating and Corporate Governance Committee approved additional compensation for the Chairman of the Board. Mr. Zenner, who was appointed Chairman, recused himself from the discussion and the Board sought the input of Pay Governance LLC, the Company’s independent compensation consultant, who benchmarked compensation practices. The Board determined that an additional retainer of $100,000 per year should be paid to the Chairman of the Board. This retainer is in lieu
| | of any fees otherwise payable as Chairman, Independent Directors. The $100,000 may be delivered in cash, payable 25% per quarter, or restricted stock that vests 25% per quarter as elected by the Chairman, provided that he remains in service with the Board. Absent an election, the amount is paid $50,000 in cash and $50,000 in restricted stock. Mr. Zenner was elected Chairman as of July 1, 2015 to serve until the 2016 Annual Meeting of Shareholders, a period of ten months. Therefore, the $100,000 payment was pro-rated to be $83,333. Mr. Zenner elected to have 50% of this amount paid in cash and 50% delivered in restricted stock.
2016 Changes to Board Compensation
Additionally, after consulting with Pay Governance, the Board approved changes to the compensation structure for our non-employee directors effective January 1, 2016. This new structure provides for $160,000 in restricted stock units annually (an increase of $30,000) and increases in cash compensation to reflect market trends. The Compensation Committee Chairman fee was increased in recognition of the additional duties required of that role. The new 2016 compensation structure is set forth below.
|
2016 Annual Meeting and Proxy Statement | 16
Table of Contents
DIRECTOR COMPENSATION
| 
|
Non-Employee Director Compensation Elements
(Effective January 2016)
Compensation Item
| | 2016 Amount
| |
| | | |
Annual Retainers and Chair Fees
| | | |
Chairman of the Board (cash or stock, as elected)
| | $100,000
| |
Board membership
| | 80,000
| |
Audit Committee Chair
| | 20,000
| |
Compensation Committee Chair
| | 20,000
| |
All Other Committee Chairs
| | 10,000
| |
Restricted Stock Units
| | 160,000
| |
| | | |
The following table shows the total 2015 compensation of our non-employee directors.
2015 Non-Employee Director Compensation
Name | | Fees Earned
or Paid
in Cash
($) | | Stock Awards
($) | | All Other
Compensation
($) | | Total
($) | |
Mark A. Buthman | | 85,000 | | 130,000 | | 9,991 | | 224,991 | |
William F. Feehery | | 80,000 | | 130,000 | | 7,032 | | 217,032 | |
Thomas W. Hofmann | | 80,000 | | 130,000 | | 15,330 | | 225,330 | |
Paula A. Johnson | | 70,000 | | 130,000 | | 20,122 | | 220,122 | |
Myla P. Lai-Goldman | | 80,000 | | 130,000 | | 1,716 | | 211,716 | |
Douglas A. Michels | | 70,000 | | 130,000 | | 11,446 | | 211,446 | |
John H. Weiland | | 90,000 | | 130,000 | | 25,358 | | 245,358 | |
Anthony Welters | | 70,000 | | 130,000 | | 42,788 | | 242,788 | |
Patrick J. Zenner | | 127,526 | | 130,000 | | 24,365 | | 281,891 | |
Fees Earned or Paid in Cash
The amounts in the “Fees Earned or Paid in Cash” column are retainers earned for serving on our Board, its committees and as committee chairs and Chairman, Independent Directors or Chairman, as applicable. All annual retainers are paid quarterly. For Mr. Zenner this amount includes the pro rata portion of his fees for serving as Chairman of the Board after July 1,
Stock Awards
The amounts in the “Stock Awards” column reflect the grant date fair value of stock-settled RSU awards made in 2015. The grant date fair value is determined under Financial Accounting Standards Board Accounting Standards Codification (“FASB ASC”) Topic 718. In 2015, each non-employee director was awarded 2,448 RSUs, with a grant date fair market value of $53.10 per share based on the closing price of our common stock on the award date, May 5,
| | 2016 and Lead Independent Director before that. The amounts are not reduced to reflect elections to defer fees under the Non-Qualified Deferred Compensation Plan for Non-Employee Directors (“Director Deferred Compensation Plan”). During 2015, Mr. Buthman, Dr. Lai-Goldman, Mr. Michels, Mr. Weiland, and Mr. Welters deferred 100% of their cash compensation.
2015. For a discussion on RSU grant date fair value, refer to Note 12 of the consolidated financial statements included in our 2015 Form 10-K.
RSUs are granted on the date of our Annual Meeting and fully vest on the date of the next Annual Meeting so long as a director remains on the Board as of that date. Generally, all unvested grants of equity forfeit upon termination.
|
2016 Annual Meeting and Proxy Statement | 17
Name | | Fees Earned or Paid
in Cash
($) | | Stock Awards
($) | | All Other
Compensation
($) | | Total
($) | |
Mark A. Buthman | | 96,250 | | 160,000 | | 12,847 | | 269,097 | |
William F. Feehery | | 87,500 | | 160,000 | | 8,889 | | 256,389 | |
Thomas W. Hofmann | | 77,500 | | 160,000 | | 16,618 | | 254,118 | |
Paula A. Johnson | | 81,667 | | 160,000 | | 20,788 | | 262,455 | |
Myla P. Lai-Goldman | | 77,500 | | 160,000 | | 3,363 | | 240,863 | |
Douglas A. Michels | | 85,833 | | 160,000 | | -0- | | 245,833 | |
Paolo Pucci (1) | | 4,153 | | 105,148 | | 29,771 | | 139,072 | |
John H. Weiland | | 90,833 | | 160,000 | | 29,771 | | 280,604 | |
Anthony Welters (2) | | 44,713 | | -0- | | 7,688,890 | | 7,733,603 | |
Patrick J. Zenner | | 128,539 | | 160,000 | | 26,552 | | 315,091 | |
Table(1) Mr. Pucci commenced service as a director on September 12, 2016 and the annual stock award typically granted in May of Contentseach year was pro-rated accordingly.
DIRECTOR COMPENSATION
(2) Mr. Welters retired as a director on May 3, 2016 and received a full distribution of his account under the Director Deferred Compensation Plan. Fees Earned or Paid in Cash | 
|
However, if a director retires during the calendar year that he reaches age 72, the award will vest pro rata on a monthly basis through the date of retirement.
The amounts in the “Fees Earned or Paid in Cash” column are retainers earned for serving on our Board, its committees and as committee chairs and Chairman, Independent Directors or Chairman, as applicable. All annual retainers are paid quarterly. For Mr. Zenner this amount includes his fees for serving as Chairman of the Board. Stock-settled RSUs are distributed upon vesting, unless a director elects to defer the award under the Director Deferred Compensation Plan. In 2015, all continuing directors elected to defer
| | their awards except for Mr. Hofmann and Mr. Zenner. All awards are distributed as shares of common stock, as described below. When dividends are paid on common stock, additional shares are credited to each director’s deferred stock account as if those dividends were used to purchase additional shares.
|
| | |
All Other Compensation
The amounts in the “All Other Compensation” column are the sum of the: (1) Dividend Equivalent Units (“DEUs”) credited to accounts under the Director Deferred Compensation Plan, and (2) with respect to Mr. Zenner and Ms.
| | Johnson, a charitable contribution of $1,000 each was made under our charitable contribution matching program, which is available to our employees, retirees and directors on a non-discriminatory basis.
|
| | |
Stock Options
Prior to 2007, non-employee directors received annual grants of stock options, which vested on the first anniversary of the grant date. After benchmarking this practice, our Board ceased granting stock options to directors. All stock
| | options are vested and expire ten years after the original date of grant. The following table sets forth all stock and stock options held by each director at the end of 2015.
|
The amounts are not reduced to reflect elections to defer fees under the Non-Qualified Deferred Compensation Plan for Non-Employee Directors (“Director Deferred Compensation Plan”). During 2016, Mr. Buthman, Mr. Michels, Mr. Pucci, Mr. Weiland and Mr. Welters deferred 100% of their cash compensation. Dr. Lai-Goldman deferred 50% of her fees.
Stock Awards
The amounts in the “Stock Awards” column reflect the grant date fair value of stock-settled restricted stock unit (“RSU”) awards made in 2016. The grant date fair value is determined under Financial Accounting Standards Board Accounting Standards Codification (“FASB ASC”) Topic 718. In 2016, each continuing non-employee director was awarded 2,262 RSUs, with a grant date fair market value of $70.73 per share based on the closing price of our common stock on the award date, May 3, 2016. Mr. Pucci was given a prorated award upon the commencement of his service on September 12, 2016. His award was for 1,277 Shares and had a grant date fair value of $105,148. For a discussion on RSU grant date fair value, refer to Note 12 of the consolidated financial statements in our 2016 Form 10-K.
RSUs are granted on the date of our Annual Meeting (or, as in the case with Mr. Pucci, upon commencement of service) and fully vest on the date of the next Annual Meeting so long as a director remains on the Board as of that date. Generally, all unvested grants of equity forfeit upon termination. However, if a director retires during the calendar year that he reaches age 72, the award will vest pro rata on a monthly basis through the date of retirement.
Stock-settled RSUs are distributed upon vesting, unless a director elects to defer the award under the Director Deferred Compensation Plan. In 2016, all continuing directors (including Mr. Pucci) elected to defer their awards except for Mr. Hofmann and Dr. Johnson. All awards are distributed as shares of common stock, as described below. When dividends are paid on common stock, additional shares are credited to each director’s deferred stock account as if those dividends were used to purchase additional shares.
All Other Compensation
The amounts in the “All Other Compensation” column are the sum of the: (1) Dividend Equivalent Units (“DEUs”) credited to accounts under the Director Deferred Compensation Plan; (2) with respect to Mr. Welters a distribution of $77,444 in cash (for amounts invested in his cash account and residual share value) and 101,604 shares of stock with an average per share value of $74.55 and total value of $7,651,590 from the Director Deferred Compensation Plan due to his retirement in May 2016; and, (3) with respect to Dr. Johnson, Mr. Weiland, Mr. Welters and Dr. Feehery, a charitable contribution of $1,000 each was made under our charitable contribution matching program, which is available to our employees, retirees and directors on a non-discriminatory basis.
Outstanding Director Stock Awards and Stock Options at Year-End 20152016
Name | | Vested Deferred Stock
Awards
(#) | | Unvested Deferred
Stock and RSU Awards
(#) | | Total Deferred Stock
and RSU Awards
(#) | | Stock Options
Outstanding
(#) | |
Mark A. Buthman | | 17,122 | | 2,457 | | 19,579 | | — | |
William F. Feehery | | 12,242 | | 2,457 | | 14,699 | | — | |
Thomas W. Hofmann | | 32,180 | | 2,457 | | 34,637 | | — | |
Paula A. Johnson | | 33,594 | | 2,457 | | 36,051 | | 7,800 | |
Myla P. Lai-Goldman | | 3,055 | | 2,457 | | 5,512 | | — | |
Douglas A. Michels | | 17,122 | | 2,457 | | 19,579 | | — | |
John H. Weiland | | 36,648 | | 2,457 | | 39,105 | | — | |
Anthony Welters | | 36,648 | | 2,457 | | 39,105 | | — | |
Patrick J. Zenner | | 37,078 | | 2,457 | | 39,535 | | 12,800 | |
Director Deferred Compensation Plan
All non-employee directors may participate in the Director Deferred Compensation Plan, which permits participants to defer all or a part of their annual cash compensation until their Board service terminates. Deferred fees may be credited to a “stock-unit” account that is deemed invested in our common stock or to an account that earns interest at the prime rate of our principal commercial bank. Stock-unit accounts are credited with DEUs based on the number of stock units credited on the dividend record date.
| | The value of a director’s account balance is distributed on termination of Board service. The value of a director’s stock-unit account is determined by multiplying the number of units credited to the account by the fair market value of our common stock on the termination date.
RSUs that a director elects to defer (and all shares of deferred stock) are distributed in shares of stock. Pre-2014 stock units may be distributed in cash in lieu of stock, if a director made an election in 2013. All post-2013 stock
|
2016 Annual Meeting and Proxy Statement | 18
Name | | Vested Deferred Stock
Awards
(#) | | Unvested Deferred
Stock and RSU Awards
(#) | | Total Deferred Stock
and RSU Awards
(#) | |
Mark A. Buthman | | 27,552 | | 2,269 | | 29,821 | |
William F. Feehery | | 18,353 | | 2,269 | | 20,622 | |
Thomas W. Hofmann | | 32,457 | | 2,269 | | 34,726 | |
Paula A. Johnson | | 41,213 | | 2,269 | | 43,482 | |
Myla P. Lai-Goldman | | 6,952 | | 2,269 | | 9,221 | |
Douglas A. Michels | | 24,301 | | 2,269 | | 26,570 | |
Paolo Pucci | | 54 | | 1,281 | | 1,335 | |
John H. Weiland | | 44,944 | | 2,269 | | 47,213 | |
Anthony Welters (1) | | -0- | | -0- | | -0- | |
Patrick J. Zenner | | 65,726 | | 2,269 | | 67,995 | |
(1) As noted above, Mr. Welters received a complete distribution of his account following his termination of service in May 2016.
Director Deferred Compensation PlanTable of Contents
DIRECTOR COMPENSATION
All non-employee directors may participate in the Director Deferred Compensation Plan, which permits participants to defer all or a part of their annual cash compensation until their Board service terminates. Deferred fees may be credited to a “stock-unit” account that is deemed invested in our common stock or to an account that earns interest at the prime rate of our principal commercial bank. Stock-unit accounts are credited with DEUs based on the number of stock units credited on the dividend record date. |
|
The value of a director’s account balance is distributed on termination of Board service. The value of a director’s stock-unit account is determined by multiplying the number of units credited to the account by the fair market value of our common stock on the termination date. RSUs that a director elects to defer (and all shares of deferred stock) are distributed in shares of stock. Pre-2014 stock units may be distributed in cash in lieu of stock, if a director made an election in 2013. All post-2013 stock units are only distributable in stock. Partial shares are distributed in cash. Directors may receive their distribution as a lump sum or in up to ten annual installments. Separate elections apply to amounts earned and vested before January 1, 2005 and amounts earned and vested after December 31, 2004. If a director elects the installment option, any cash-account balances during the distribution period will earn interest at the prime rate of our principal commercial bank and deferred stock and stock-settled units will be credited with DEUs until paid. Directors may receive their distribution as a lump sum or in up to ten annual installments. Separate elections apply to amounts earned and
| | vested before 2005 and amounts earned and vested after December 31, 2004. If a director elects the installment option, any cash-account balances during the distribution period will earn interest at the prime rate of our principal commercial bank and deferred stock and stock-settled units will be credited with DEUs until paid.
|
Director Deferred Compensation Plan at Year-End 20152016
The following table summarizes the amounts credited to each Director Deferred Compensation Plan account as of December 31, 2015:2016:
Name | | Cash-Settled
Stock Units
Value(1)
($) | | Stock-Settled
Stock Units
Value(1)
($) | | Deferred Stock
and RSU Value (1)
($) | | Amount Invested in
Cash Account (2)
($) | | Total Account
Balance
($) | | | Cash-Settled Stock
Units Value(1)
($) | | Stock-Settled Stock
Units Value (1)
($) | | Deferred Stock
and RSU Value (1)
($) | | Total Account
Balance
($) | |
Mark A. Buthman | | -0- | | 386,372 | | 1,179,047 | | -0- | | 1,565,419 | | | -0- | | 660,995 | | 1,865,157 | | 2,526,152 | |
William F. Feehery | | -0- | | 194,812 | | 885,174 | | -0- | | 1,079,986 | | | -0- | | 298,771 | | 1,448,218 | | 1,746,989 | |
Thomas W. Hofmann | | -0- | | -0- | | 2,085,840 | | -0- | | 2,085,840 | | | -0- | | -0- | | 2,941,565 | | 2,941,565 | |
Paula A. Johnson | | -0- | | 437,559 | | 2,170,991 | | -0- | | 2,608,550 | | | -0- | | 620,786 | | 3,062,448 | | 3,683,234 | |
Myla P. Lai-Goldman | | — | | 51,307 | | 331,933 | | — | | 383,240 | | | -0- | | 117,914 | | 663,371 | | 781,285 | |
Douglas A. Michels | | 377,837 | | 573,174 | | 1,179,047 | | -0- | | 2,130,058 | | |
John H. Weiland | | 1,085,291 | | 1,331,645 | | 2,354,903 | | -0- | | 4,771,839 | | |
Anthony Welters | | -0- | | 3,716,839 | | 2,354,903 | | 76,224 | | 6,147,966 | | |
Patrick J. Zenner | | -0- | | 976,046 | | 2,380,798 | | -0- | | 3,356,844 | | |
Name | | Cash-Settled Stock
Units Value(1)
($) | | Stock-Settled Stock
Units Value (1)
($) | | Deferred Stock
and RSU Value (1)
($) | | Total Account
Balance
($) | |
Douglas A. Michels | | 532,247 | | 385,613 | | 1,865,157 | | 2,783,017 | |
Paolo Pucci | | -0- | | 4,750 | | 108,498 | | 113,248 | |
John H. Weiland | | 1,528,816 | | 465,962 | | 3,533,254 | | 5,528,032 | |
Anthony Welters | | -0- | | -0- | | -0- | | -0- | |
Patrick J. Zenner | | -0- | | 1,384,680 | | 3,353,330 | | 4,738,010 | |
(1) Value is determined by multiplying the number of stock units or shares of deferred stock, as applicable, times $60.22,$84.83, the fair market value of a share of stock on December 31, 2015.2016. Stock units relate to deferred compensation that has previously been reported in the “Fees Earned or Paid in Cash” column for the year the compensation was earned.
(2)The amount invested in cash account earned interest at a rate of 3.25% compounded quarterly for the first three quarters of 2015 and 3.5% compounded quarterly for the last quarter of 2015, which resulted in $2,435 in the aggregate being credited to Mr. Welters’ account in 2015.
2016 Annual Meeting and Proxy Statement | 19
Table of Contents
EXECUTIVE COMPENSATION
| 
|
Executive Summary
Our Compensation Philosophy and Goals
We believe that our long-term success is directly related to our ability to attract, motivate and retain highly talented individuals committed to continually improving financial performance, achieving profitable growth on a sustainable basis and enhancing shareholder value.
To that end, our Compensation Committee (all subsequent references to “Committee” in this section are to the Compensation Committee) has developed and implemented a pay-for-performance compensation philosophy that closely aligns our executives’ incentive compensation with Company performance and shareholder interests on a short- and long-term basis without promoting excessive risk. When we deliver expected performance, our pay should approximate the market median. Actual compensation, however, varies with our performance.
The Annual Incentive Plan (“AIP”), our annual cash incentive bonus plan, is based primarily on our performance on twothree financial measures: adjusted dilutedAdjusted Diluted EPS, Adjusted operating cash flow (“Adjusted OCF”) and adjusted operating cash flow. Performance standards for regionalconsolidated revenue (“Adjusted Revenue”). During 2016, we also realigned annual incentive plan targets and divisional heads, including Mr. Paproskiour incentive compensation philosophy consistent with our new organizational structure announced in the first quarter and Ms. Flynn, also includedour refined enterprise strategy. These revised targets for divisional sales, operating profitwill help ensure alignment between business performance and cash flow. Mr. Paproski, who led our Delivery Systems business unit in 2015, where innovation is keypay.
Adjusted Revenue was added to the targets used previously to provide further incentive to our success, is also subjectentire organization to goals based on reaching milestones forincrease our key innovative projects.sales and expand our business. No awards are paid unless performance exceeds the threshold of 85% of the target. At the 85% level only 50% of the AIP target is paid.
Our long-term incentive awards are aligned with shareholder interests because they deliver value based on the achievement of the three-year compound annual growth rate (“CAGR”) and the return on invested capital (“ROIC”) targets, along with encouragingtargets. The plan also encourages share ownership and helps in the retention of key talent.
As in prior years, we undertook a review to ensure our long-term goals were delivering shareholder value. That review indicated that our long-term incentive plan payouts are highly-
correlatedhighly-correlated with our TSR over the performance period and that our TSR outpaces our peers and the market as a whole.
A significant portion of the total compensation opportunity for each of our executives, including the named executive officers or “NEOs,”NEOs, is directly dependent on the achievement of pre-established corporate goals.
Our New Leadership Structure
On January 12, 2016, we announced a reorganization of the Company including the manner in which we managegoals — more than 75% for our business. Key changes include:CEO and more than two-thirds for our other NEOs.
·Formation of a Commercial organization led by Ms. Flynn. This organization will leverage the strength of West’s proprietary product portfolio by focusing on three key customer markets – Biologics, Generics and Pharmaceuticals, and also includes our contract manufacturing business unit;
·Formation of the Innovation and Technology organization initially led by Mr. Paproski. Mr. Paproski announced his retirement effective April 1, 2016 and will be succeeded by Eric Resnick. This organization will focus on product design and development to push the leading-edge of applications to contain, administer and deliver injectable therapies. These include new delivery platforms, such as the SmartDose® wearable injector, and new applications of Daikyo Crystal Zenith® technology; and,
·Consolidation of our global operating footprint with the newly formed Global Operations organization. This organization reports directly to the CEO.
2016 Annual Meeting and Proxy Statement | 20
This realignment will enable our teams to be more responsive and proactive, addressing the needs and challenges of each specific customer group and driving improvements and efficiencies in our global operations and supply chain.
During 2016, we also realigned annual incentive plan targets and philosophy consistent with our new organizational structure and our refined enterprise strategy. These revised targets will help ensure alignment between business performance and pay.
Investor Outreach and 20152016 Say-on-Pay Results
At our 20152016 Annual Meeting of Shareholders, we held a shareholder “Say-on-Pay” advisory vote to approve the compensation of our NEOs as disclosed in our Proxy Statement. Shareholders expressed overwhelming support for the compensation of our NEOs, with approximately 98.7%99% of the votes (present at the meeting and entitled to vote) cast to approve NEO compensation.
The Committee considered this vote as demonstrating strong support for our compensation programs and continued to apply the same effective principles and philosophies that have been applied in prior years when making compensation decisions for 2015.2016. These
principles and philosophies are highlighted above and described more fully below.
To ensure that the Committee considers shareholder views on compensation matters, we maintain an active shareholder engagement program. Throughout the year, we meet with our actively-managed, institutional shareholders, which represent in the aggregateown a majority of our shares. These shareholders have historically expressed support for our long-term performance goals, including ROIC and CAGR. The Committee receives regular updates on investor feedback and understands that shareholders remain very focused on the alignment of pay and performance.
20152016 Financial Highlights
The Company delivered exceptional financial performance in 2015,2016, achieving record net sales, adjusted operating profit and adjusted dilutedAdjusted Diluted EPS. Compared to 20142015 net sales increased 7.2%9.1% (at constant currency exchange rates), gross margin grew by 1100.6 margin points to 32.6%33.2%, adjusted operating margin grew 701.2 margin points to 13.6% 14.8% and adjusted dilutedAdjusted Diluted EPS increased 19%21.3% (at constant currency exchange rates). For additional information please see “Performance and Compensation Highlights” on page 2.
Our shareholders also benefitted as we delivered a three-year and one-year TSR which exceeded
the average of the S&P 500 and the Business Segment Comparator Group of companies we use for benchmarking our executive compensation.
As discussed in more detail below, our annual incentive plan uses a one-year measurement period and our long-term incentive plan uses three-year metricsmetrics. Despite favorable comparisons to our competitive group and the market in general, due to performance at levels that were less than our strong performance in each period, both programsambitious growth targets, we paid at higher than target levels. This is in contrast to 2014 when our AIP paidout at less than target100% for both plans. However, long-term incentive plan recipients benefitted from the 77% TSR, including dividend equivalents and our annual TSR, while strong,a price increase from $47.34 on February 24, 2014, which was less favorable comparedthe grant date for executives who were employed at the beginning of the period, to $86.93, the market.price on the payout date, February 14, 2017. Our NEOs also benefitted from this price appreciation with regard to options awarded on that date (or their employment commencement date, if later).
One-Year Comparative TSRThree-Year Cumulative TSR
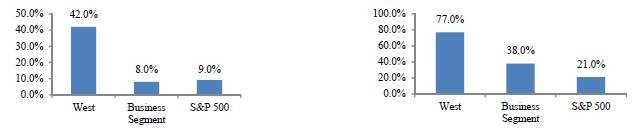
Executive Compensation Elements
One-Year Comparative TSRCompensation
Component
| Three-Year Cumulative TSR
|
| Objectives |
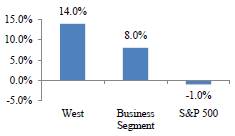
| 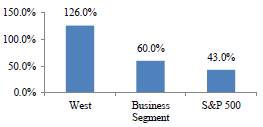
|
2016 Annual Meeting and Proxy Statement | 21
Table of Contents
| EXECUTIVE COMPENSATION
| 
|
Executive Compensation Elements
Compensation
Component
| | Objectives
| | Key Features
|
Base Salary | | Fair and competitive compensation to attract, retain and reward executive officers by providing a fixed level of cash compensation tied to experience, skills and capability relative to the market | | · Annual cash compensation that is not at risk
· Targeted toat the 50th percentile of our compensation comparator groups, with variations based on experience, skills and other factors
· Adjustments considered annually based on level of pay relative to the market, individual and Company performance |
Annual Incentive
Award | | Focuses executives on annual results by rewarding them for achieving key budgeted financial targets
Links executives’ interests with those of shareholders by promoting profitable growth
Helps retain executives by providing market-competitive compensation
| | · At-risk cash awards based on adjusted dilutedAdjusted Diluted EPS, Adjusted Revenue and adjusted operating cash flow, and when applicable division performance objectives,Adjusted OCF, calculated at budgeted exchange rates and adjusted for unusual or non-recurring items
· Annual award payouts may vary from 0% to 150% of the targeted award |
Long-Term Incentive
Award (PVSUs(PSUs and
Stock Options) | | Aligns executives’ interests with those of shareholders by linking compensation with long-term corporate performance that benefits our shareholders
Retains and provides incentives to executives through multi-year performance-vestingperformance share units (“PVSUs”PSUs”) and stock options
Promotes a sensible balance of risk and reward, without encouraging unnecessary or unreasonable risk taking | | · Performance-based long-term compensation
· Generally targeted at a level that, when aggregated with AIP and base salary, will provide total direct compensation at the 50th percentile of comparator groups
· Uses PVSUsPSUs and stock options to provide rewards for both financial performance and increased stock price
· PVSUsPSUs have a three-year performance period; stock options vest in annual increments over a four-year period
· Shares earned under PVSUPSU awards vary from 0% to 200% of targeted award |
Retirement PlanPlans and
Non-Qualified Deferred
Compensation Plan | | Attracts and retains executives by providing a level of retirement income and retirement savings in a tax-efficient manner | | · Provides a defined-benefit plan that transitioned to a cash-balance plan formula in 2007, which will be frozen in December 2018 and replaced with a non-elective defined contribution amount in January 2019
· Executives may elect to defer up to 100% of their annual cash compensation |
20152016 Performance-Based Bonuses (Cash)
AIP payouts for all officers, including the NEOs, are based on our performance against twothree principal corporate financial metrics: adjusted dilutedAdjusted Diluted EPS, Adjusted Revenue and adjusted operating cash flow. Payouts for executives who manage divisional business units also depend partially on divisional
performance.Adjusted OCF. The target bonus is set as a percentage of base salary, which for the NEOs, ranges from 65%60% to 100%. Mr. Miller was not eligible for an2016 AIP bonus in 2015 due to his hire date being after November 15, 2015, which is a uniform requirement in the plan. 2015 AIP
2016 Annual Meeting and Proxy Statement | 22
target goals were set by the Committee based on the budget approved by the Board and the Committee’s determination that the targets contained sufficient “stretch.” This analysis is aided by a retrospective look at our performance compared to our competitors and payout history completed by the Board’s compensation consultant, Pay Governance, annually.
During 2015,2016, we significantly exceeded our target levels, for Adjusted Revenue and Adjusted Diluted EPS achieving 107.4%102.3% and 101.8%, respectively compared to target. We exceeded threshold at 85.3% for Adjusted OCF, but below target level resulting in an overall payout of 95.3% for these corporate metrics for all NEOs except Ms. Flynn who had a 98.4% payout due to different weightings discussed below. While our established corporate targets, which apply to all AIP participants. ThisEPS performance was moresimilarly favorable than in 2014, when we did not reach our target2016, overall performance levels.was less so due to underperformance on Adjusted OCF. These results and consequent lesser payouts demonstrate our pay-for-performance philosophy
discussed in the “Compensation Discussion and Analysis” below. During 2014, the payouts under the AIP, which measures short-term performance, were less than 100%; while in 2015, when the short-term performance was better, the payouts were correspondingly higher. A reconciliation of the adjusted dilutedAdjusted Diluted EPS and adjusted operating cash flowAdjusted OCF to amounts reported under U.S. GAAP is provided below under “Financial Measures.”
20152016 AIP Performance Against PrimaryCorporate Metrics
Threshold, Target and Actual Performance
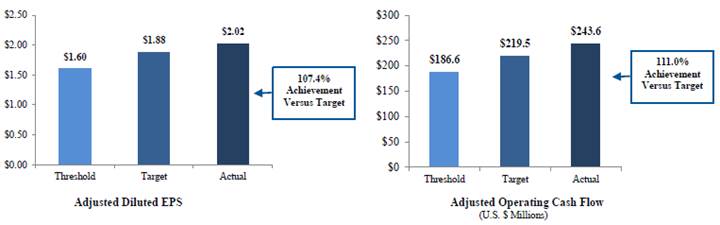
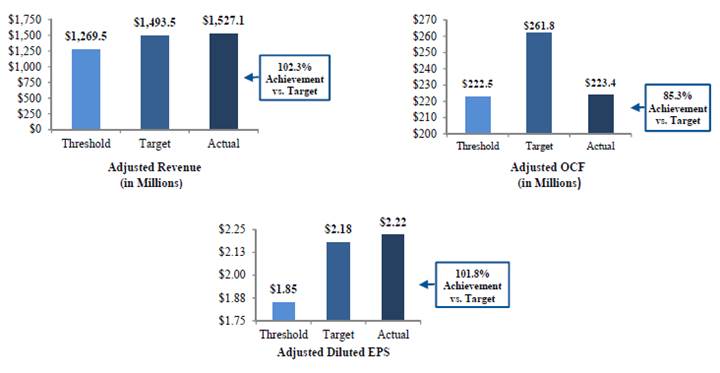
20152016 Long-Term Incentive Awards (Equity)
Long-term incentive compensation opportunities for our executives, including the NEOs, are entirely equity based. Executives receive an award of PVSUsPSUs and time-vested stock options, approximately equal in expectedgrant date fair value. The value of each NEO’s long-term grant is determined by the Committee based on its review of peer-group market data, the
executive’s roles and responsibilities, his or her impact on our results, and advancement potential. PVSUsPSUs entitle the recipient to receive common shares based on achievement of three-year CAGR and ROIC targets. The following chart shows the performance against target and threshold for the three-year performance period that ended December 31, 2015.2016.
Performance Against Long-Term Metrics (1) – 2013-2015 — 2014-2016 Performance Periods
CAGRROIC
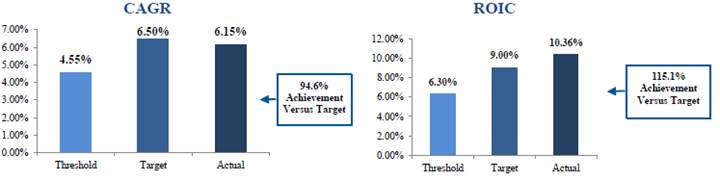
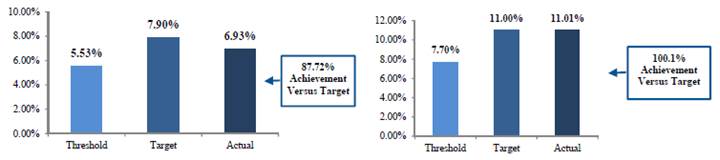
(1) Calculated at 20152016 budgeted foreign exchange translation rates.
2016 Annual Meeting and Proxy Statement | 23
Table of Contents
| EXECUTIVE COMPENSATION
| 
|
Our Compensation Practices
We continue to incorporate leading practices into our compensation programs:
· Our compensation philosophy targets total direct compensation of our NEOs at the 50th percentile of comparator group companies.
· We prohibit our officers and directors from hedging, pledging or engaging in any derivatives trading with respect to our common stock.
· Our equity incentive plan prohibits the repricing or exchange of awards without shareholder approval.
· DEUsDividend equivalent units are paid on equity awards only if the underlying award is earned and vested.
· We conduct realizable-pay analyses on our CEO compensation and review tally sheets to provide additional benchmarking information on executive pay.
· We require a “double-trigger” feature and have not provided golden parachute excise tax gross-ups in any change-in-control agreements offered to executives after 2010, including our new CEO.2010.
· We require our executive officers to meet share-ownership guidelines, and to take a portion of their bonus in shares until their ownership guidelines are met. The ownership guideline for our CEO is six times base salary and the guideline for our other executivesofficers is two times base salary.
· The Committee has engaged an independent outside compensation consultant. See “Role of the Compensation Consultant and Executives.”
· The Committee may cancel or recover any cash- or equity-based incentive compensation based on achievement of specified financial results that are the subject of a subsequent restatement. We will seek repayment of any amount determined to have been inappropriately received due to mathematical errors, fraud, misconduct or gross negligence.
· We annually review the potential risk associated with our compensation programs.
Compensation Committee Report
The Compensation Committee has reviewed and discussed with managementManagement the “Compensation Discussion and Analysis.” Based on its review and discussions with management,Management, the Compensation Committee recommended to the Board, and the Board approved, the inclusion of the “Compensation Discussion and Analysis” in this Proxy Statement and in the Company’s Annual Report on Form 10-K for the fiscal year ended December 31, 2015.2016.
Compensation Committee
John H. Weiland,Douglas A. Michels, Chairman
Thomas W. Hofmann
Douglas A. MichelsPaolo Pucci
2016 Annual Meeting and Proxy Statement | 24
Table of Contents
| EXECUTIVE COMPENSATION
| 
|
John H. Weiland
Compensation Discussion and Analysis
This section discusses our executive compensation programs for 2015,2016, the compensation decisions made under those programs and the factors that were considered by the Committee in making those decisions. It focuses on the compensation for each of our NEOs for 2015:2016:
· Eric M. Green, President and Chief Executive Officer;
· William J. Federici, Senior Vice President, and Chief Financial Officer;Officer and Treasurer (1);
· Karen A. Flynn, Senior Vice President and Chief Commercial Officer (formerly, President, Pharmaceutical Packaging Systems);Officer;
· John E. Paproski, Senior Vice President and Chief Technology Officer (formerly, President, Pharmaceutical Delivery Systems);
· George L. Miller, Senior Vice President, General Counsel and Corporate Secretary; and
· Donald E. Morel, Jr., Former ChairmanAnnette F. Favorite, Senior Vice President and Chief Executive Officer.Human Resources Officer (“CHRO”).
(1) Mr. Federici was named Treasurer effective January 1, 2017 with the retirement of our previous Treasurer, Michael A. Anderson, on December 31, 2016.
This Compensation Discussion and Analysis is divided into two parts:
Part 1 discusses our 20152016 performance, the Committee’s actions in 2015,2016, our compensation practices and the compensation decisions for our NEOs.
Part 2 discusses our compensation framework in more detail, including how we apply our compensation philosophy and determine competitive positioning of our executive compensation and other policies.
Part 1 – 2015— 2016 Performance, Compensation Committee Actions, Compensation Practices and Decisions
20152016 Performance Overview
20152016 was an outstanding year for the Company and its shareholders. Among the accomplishments of our executive team were:
· Net sales increased by $102.3$126.8 million, or 7.2%9.1% (excluding foreign currency effects) and adjusted dilutedAdjusted Diluted EPS increased 19%21.3% at constant currency exchange rates.
· Our 20152016 gross margin improved to 32.6%33.2%, an increase of 1100.6 margin points and our adjusted operating margin increased by 701.2 margin points to 13.6%14.8%.
· Continued emphasis on products that meet higher quality standards and create greater revenue, which resulted in 20152016 sales growth of 14.8%19.5% at constant currency exchange rates for PPS high-value products.
· PDS continued to make progress toward the U.S. Food and Drug Administration approval of the SmartDose wearable injector, which features a silicone-free Daikyo Crystal Zenith cartridge and a FluroTecIntroduced new 1-3mL NovaPure® coated piston containment system. plunger using Quality by Design principles.
· Continued momentum on the development of our SmartDose® electronic wearable injector, which was approved for use in the U.S. in July 2016.
·Contract manufacturing products sales increased 6%5.9% over 20142015 on a constant currency basis.
2016 Annual Meeting and Proxy Statement | 25
Table of Contents
| EXECUTIVE COMPENSATION
| 
|
· Completed the validation of our Kinston, North CarolinaContinued construction and progress on a new state-of-the-art production facility to address demand for high-value products, while also making progress in the construction of our Waterford, Ireland, campuswhich is scheduled to address longer-term product demands.begin commercial operations in 2018.
· Increased quarterly dividend to $0.12$0.13 per share.
·Seamless transition of leadership of the Company to the new CEO, Mr. Green, and strengthening of the leadership team through key executive officer hires.
As discussed in this Proxy Statement, our overall one-year performance during 2015 exceeded our2016 fell below targeted levels, and payouts under the AIP accordingly were greaterless than 100% of target. Additionally, our three-year performance was outstanding when measured byat ROIC target but below our CAGR and ROIC. Therefore, payouts undertarget, which makes up 50% of our long-term incentive plan were higher.payout, and, therefore, that payout was lower. Both our annual and long-term TSR performance exceeded the average performance of our peer group and the S&P 500. Our one-year TSR performance exceeded the 69th95th percentile and our three-year performance exceeded the 94th86th percentile among our peers. Reflective of our pay-for-performance philosophy, long-term incentive plan participants share in this price increase over the performance period, as payout values greatly exceed original grant date fair values. These participants also share in the price increase to the same extent as our shareholders, with increasing option values.
20152016 Committee Actions
The Committee regularly evaluates the design and performance of our executive compensation programs to ensure they are operating as intended and consistent with relevant benchmarks and market practices. The
Committee also reviews its compensation philosophy each year. As a result of these evaluations and reviews, the Committee took the following actions in 2015:2016:
Action | |
| Rationale |
| | | |
Pay-for-Performance Review— Conducted a formal pay-for-performance review of CEO compensation versus Business Segment Comparator Groups consistent with analyses done by third-party shareholder advisory services. | | | Provides a complete view of the alignment of compensation and company performance versus our peers and the market. |
| | |
| | |
Realizable Pay Analysis — Conducted a realizable pay analysis, which assesses whether Company performance and CEO realizable pay are aligned over a given period of time. | | |
| | | |
| | period. | |
Performance Goal Difficulty Analysis —Conducted an analysis regarding the difficulty of achievement of performance goals established under the AIP and LTIP. | | | Provides the Committee with perspective regarding the difficulty of attaining established performance goals, the rigor of the process establishing those goals and the motivational aspects of those awards. |
| | | |
| | | |
Comparator Groups — Reviewed the criteria for selecting members of the Business Segment and Broad Talent Comparator GroupsMarket comparator groups and made no changes. | changes to each to reflect our growth, renewed market-led focus and further align with the companies that we actually compete with for talent. | | Ensures robust and aligned comparative compensation data for officer positions where there is sufficient data. Ifpositions. The data is insufficient or inconclusive, the Broad Talent Comparator group is used.are used to arrive at coherent and competitive compensation decisions for our CEO and other NEOs. |
Redesigned our Annual Incentive Plan Metrics and Targets — In light of the reorganization announced in 2016, we revised the metrics, targets and weightings used for our NEOs. | | | Creates greater alignment with our new commercial, operations, contract manufacturing and innovation and technology business units while harmonizing corporate goals for all participants to ensure alignment with overall Company performance. |
2016 Annual Meeting and Proxy Statement | 26
Table of Contents
| EXECUTIVE COMPENSATION
| 
|
| | | |
Benchmarked and Established Compensation for our incoming Officers — Reviewed the compensation paid to Chief Executive Officer, General Counsel and Chief Human Resources Officer of our comparator groups.
| | | Attracts and retains qualified executive officers to ensure the continued outstanding performance of the Company.
|
| | | |
| | | |
Provided Transition Awards to our Outgoing Chief Executive Officer — We provided a long-term incentive award and other remuneration to our outgoing CEO.
| | | Ensured the smooth transition from Dr. Morel to Mr. Green and provided consideration for Dr. Morel remaining with the Company longer than he had originally anticipated to assist with leadership transition.
|
| | | |
Executive Compensation Elements
The following chart summarizes the key features of each element of our executive compensation program: Cash (salary and annual bonus); equity (long-term incentive); retirement (Retirement Plan, Supplemental Employee Retirement Plan (“SERP”), 401(k) Plan, and Employee Nonqualified
Deferred Compensation Plan); and other compensation (perquisites). Each type is discussed in detail in the remainder of this Compensation Discussion and Analysis, and the accompanying tables.
Element | | |
Type
| | |
Key Features
|
| | | | | | Type |
| | | | | | Key Features |
Cash | | | Salary | | | · Fixed amount of compensation based on experience, contribution and responsibilities. · Salaries reviewed annually and adjusted based on market practice, individual performance and contribution, length of service and other internal factors. |
| | | | | | |
| | | | | | |
| | | Retention Cash (for CEO) | | | · Attracts and retains top-level talent for our senior-most positions.positions, when necessary. · ReplacesTypically, only used to replace equity or cash compensation foregone from prior employer, facilitating our ability to attract key leadership. · PaidNone granted in 2016 but awards continued to Mr. Green after six months of employment.vest as a retention tool. |
| | | | | | |
| | | | | | |
| | | Annual Incentive Plan | | | · Performance-based cash awards based on adjusted dilutedAdjusted Diluted EPS and adjusted operating cash flow,Adjusted OCF, calculated at budgeted exchange rates and adjusted for unusual or non-recurring items. See “Financial Results for AIP Purposes” on page 33.30. · Annual awards vary from 0% to 150% of the targeted amount. |
| | | | | | |
2016 Annual Meeting and Proxy Statement | 27
Table of Contents
| EXECUTIVE COMPENSATION
| 
|
| | | | | | |
Long-Term
Incentive
Compensation
(100% (100% Equity) | | | Annual PVSU grantPSU Grant
(50% of normal annual grant date fair value) | | | · PVSUsPSUs are settled three years from the grant date based on performance over a three-year period. · DEUs are accumulated on PVSUsPSUs during the vesting period. · Both PVSUsPSUs and DEUs are paid in shares of West common stock and only upon vesting. · The number of shares (inclusive of DEUs) that may be earned over the performance period is based on achievement against target of two equally weighted measures—CAGR and ROIC—and ranges from 0% to 200% of the target award. See “Our Long-Term Equity Incentive Program,” beginning on page 35.31. |
| | | | | | |
| | | | | | |
| | | Annual Non-qualified stock option grantNonqualified Stock Option Grant
(50% of typicalnormal annual grant value) | | | · Annual awards vest in four equal annual installments and expire 10 years from the grant date. · Options must be issued at or in excess of the closing price on the date of grant. · DEUs are not provided on options. |
| | | | | | |
| | | | | | |
| | | Time-Vesting Restricted Stock and Retention Options | | | · Special retention option and restricted stock awardNone granted in 2016, but awards granted to Mr. Green upon his start date vests 42.9% (i.e., $1.5 million of the $3.5 million of total grant date fair value) on the third anniversary of his start dateexisting NEOs continued to vest and 57.1% (i.e., $2.0 million of the $3.5 million of total value) on the fifth anniversary of his start date.serve to attract and retain NEOs hired in 2015. · Restricted stock vests 100% after 4 years for Mr. Miller. ·Attracts talented executives who are foregoing compensation from prior employer.
· Provides a retention tool for new executives, provides an immediate ownership stake in the Company and alignment with shareholders through an incentive to increase the stock value. |
| | | | | | |
| | | | | | |
Retirement | | | Retirement Plan | | | · Provides retirement income for eligible participants based on years of service and highest average earnings up to tax codeU.S. Internal Revenue Code (“Code”) limits. |
| | | | | | |
| | | | | | |
| | | SERP | | | · Provides retirement income, on a non-qualified basis, in excess of U.S. Internal Revenue Code (“Code”) limits on the same basis as the Retirement Plan. |
| | | | | | |
| | | | | | |
| | | 401(k) Plan | | | · Qualified 401(k) plan that provides participants the opportunity to defer taxation on a portion of their income, up to Code limits, and receive a matching Company contribution. |
| | | | | | |
| | | | | | |
| | | Employee Nonqualified Deferred Compensation Plan | | | · Extends, on a non-qualified basis, the 401(k) plan deferrals in excess of Code limits on the same terms. |
2016 Annual Meeting and Proxy Statement | 28
Table of Contents
EXECUTIVE COMPENSATION
| 
|
Summary of Key 20152016 Compensation Decisions
The Committee reviewed our pay practices, including benchmarking our process and concluded to not make any significant changes to our compensation structure in light of the strong linkage between pay-for-performance and the Company’s positioning relative to its peers.
The following highlights the Committee’s key NEO compensation decisions for 2015,2016, as reported in the Summary Compensation Table on page 45.41. The decisions were made after considering input from the Committee’s independent compensation consultant, Pay Governance.Governance, the CEO (for pay other than his own) and the CHRO (for pay other than her own).
Incoming CEO Compensation
During AprilMr. Green’s 2016 pay elements were considered after a thorough review of CEO realizable pay and pay-for-performance materials distributed by Pay Governance. The materials examined realizable pay and performance as compared to our peer groups and realized pay (actual compensation received including stock option exercises and stock vesting) versus pay opportunity. The Committee concluded that our aggregate performance and CEO pay were aligned on a one-year and three-year basis. Strong stock price growth has also contributed to pay that demonstrates a strong linkage between pay and performance.
The Committee held an executive session with Pay Governance and Ms. Favorite during which Mr. Green’s 2015 objective attainment and proposed 2016 objectives were reviewed. Additionally, the ad hoc Succession Planning Committee on behalf ofconsidered Mr.
Green’s position in the Board, authorized the Compensation Committee and its counselmarket. Compared to negotiate a compensation package for Mr. Green as the new CEO of the Company. After benchmarking appropriate compensation levels and standard terms and conditions for a CEO against our Business Segment and Broad Talent Comparator Groups, and taking into account the amount of compensation Mr. Green would forfeit at his former employer if he were to voluntarily resign that position to join West, the Compensation Committee approved the following material terms and conditions:
· Three-year employment agreement, with a two-year term renewal and successive one-year renewal;
· $700,000 base salary;
· 100% AIP target;
· An LTIP award for the 2015-17 performance period with a grant date fair value of $1,700,000 and a partial-cycle LTIP award for the 2014-16 performance period with a grant date fair value of $1,150,000;
· A sign-on retention award of $500,000 cash payable after six months and an equity grant of $3,500,000 equally split between options and restricted stock that vests 42.9% (i.e., $1.5 million of the $3.5 million of total grant
| | date fair value) on the third anniversary of his start date and 57.1% (i.e., $2.0 million of the $3.5 million of total value) on the fifth anniversary of his start date;
· The Company’s standard change-in-control (“CIC”) arrangement that provides in the event of Mr. Green’s termination following a CIC (i.e., a double-trigger), he will receive the following benefits: a severance amount equal to two times salary plus average bonus, vesting of all equity, and a cutback of benefits if the benefits would exceed the excise tax threshold under the Internal Revenue Code and the cutback would be more advantageous on an after-tax basis to Mr. Green (i.e., a “modified cutback”); and,
· Twelve-month non-compete and non-solicitation requirements.
|
The approved compensation package targetedGroup, Mr. Green’s base salary and total compensation at approximatelycash consideration (“TCC”), which is the 25sum of his base salary and AIP target, were 15% and 20% below the 50th percentile, respectively. Additionally, Mr. Green’s Total Direct Compensation (“TDC”), which is the sum of peer company CEOs for base salary, annual bonushis TCC and long-term incentives, whichincentive plan opportunity, was deemed appropriate atapproximately 29% to 43% below the timemedian of each of our comparator groups.
Based on the Company’s strong performance, and Mr. Green’s relatively low pay given his experience level. Additionally,that he was appointed CEO in 2015, and the CompensationCommittee’s desire to bring Mr. Green closer to the 50th percentile over a three-year period (assuming continued outstanding performance), the Committee determined it was necessary to provide a significant retention award and signing bonus of cash, restricted stock and options to replace compensation Mr. Green would forfeit upon departure from his previous employer.that increases should be slightly larger than might be expected annually going forward than those for other officers. The Committee also believes these retention/sign-on awards create further alignmentapproved a 10.7% increase in salary from $700,000 to $775,000 and an increase in long-term incentive opportunity from $1,700,000 to $2,000,000, which is a 17.6% increase. The larger increase for long-term incentive reflects the Committee’s commitment to maintaining a healthy pay mix weighted towards long-term goals, which most closely aligns with our shareholders over an extended period of time (up to five years before fully vesting) by ramping up his stock ownership, lockingand locks in his commitment to growing shareholder valuevalue.
Compensation of Other NEOs
The Committee approved salaries and aligning his financial interests with thoseset incentive-compensation targets of the shareholders through stock appreciation.
other NEOs taking into account the CEO’s recommendations, the advice of Pay Governance, comparator group salary, TCC and TDC data, relative duties and responsibilities, advancement potential and impact on our financial and strategic performance. Upon reviewing the data, Mr. Federici and Ms. Flynn were both modestly below the 50th percentile of our comparator groups from a TCC and TDC perspective. Given our strong performance, that these executives took on new challenges and individually performed well during our transition in management and refreshing of our enterprise strategy, increases of 4.44% and 6.95% were proposed for Mr. Federici and Ms. Flynn respectively. Additionally, to shift our pay mix to be more variable and incentive-based, and better align with the market, the Committee approved an increase in Mr. Federici’s AIP target from 70% to 75%. The Committee also approved an increase in Ms. Flynn’s LTIP target value from $600,000 to $700,000 to align her TDC better with market. Mr. Miller and Ms. Favorite were both hired late in 2015 and their pay had been benchmarked based on their experience and in a manner consistent with our internal pay structure. Therefore, the Committee made no changes to their 2016 Annual Meeting and Proxy Statement | 29
Table of Contents
EXECUTIVE COMPENSATION
| 
|
Compensation of Other NEOs
The Committee approved salaries and set incentive-compensation targets of the other NEOs taking into account the CEO’s recommendations, the advice of Pay Governance, comparator group salary data, relative duties and responsibilities, advancement potential and impact on our financial and strategic performance. Consistent with prior years, the Committee provided a modest increase of 3% in annual base salary for Mr. Federici and Mr. Paproski. During 2014, Ms. Flynn was promoted from President, PPS, Americas to
Outgoing CEO Compensation
Dr. Morel announced his intention to retire in October 2014, with the expectation that his retirement would be effective before the 2015 Annual Meeting of Shareholders in May. Based on this expectation, the Compensation Committee determined that it would not provide Dr. Morel with a salary increase nor AIP target adjustment for 2015. Further, the Committee and Board initially decided not to award Dr. Morel a long-term incentive grant for 2015 given his impending retirement. However, as Dr. Morel’s retirement approached, the Board believed that his continued involvement with the
| | President, PPS, and had a 4% increase at that time, and therefore, received only a 2% increase in May 2015. Her base salary was further increased 3.1% to reflect the elimination of her car allowance in August 2015. Mr. Miller was hired on November 19, 2015. The setting of his salary and other compensation elements are discussed below. These increases are in line with the average increases at our comparator groups and broader employee population during 2015, which were approximately 3.5%.
Company on a consultative basis would be in the long-term best interests of the Company and shareholders. Additionally, the Board and Compensation Committee determined it appropriate to reward Dr. Morel for continued service as Chairman of the Board beyond retirement as CEO, his pre-retirement strategic decisions and smooth transition of his CEO duties to Mr. Green and Chairman duties to Mr. Zenner. Therefore, the Compensation Committee and Board entered into a Retirement Separation Agreement with Dr. Morel, effective June 30, 2015.
|
The material terms of the Retirement Separation Agreement are as follows:
· Consistent with the Company-wide policy approved in 2014, continued vesting of PVSUs and options that had been granted for prior periods, as if Dr. Morel remained employed (this affected only his 2012 and 2013 LTIP awards);
· An equity grant with a $2.4 million grant date fair value – 50% in PVSUs for the 2015-17 performance period and 50% in options;
| | · A 50% payout of his 2015 AIP award, payable at the same time and subject to the same conditions as applies to other corporate NEOs; and
· Transfer of his Company automobile to him for one dollar.
|
| | |
In exchange for the above remuneration, Dr. Morel agreed to a six-month consulting engagement in which he would cooperate on any required matters (including litigation) and released the Company of any applicable legal
| | claims and agreed to additional restrictive covenants. The rationale for each element of Dr. Morel’s Retirement Separation Agreement payments is set forth in the chart below.
|
2016 Annual Meeting and Proxy Statement | 30
Table of Contents
EXECUTIVE COMPENSATION
| 
|
Element
| Value
| Rationale
|
2015 Base Salary
| $461,847
| ·Fixed amount of compensation based on annual salary as CEO and responsibilities as Chairman of the Board through June 30 (his retirement date).
|
Pro Rata 2015 Annual Incentive Plan Bonus
| $537,413
| ·Actual (above-target) bonus earned only for services as CEO and Chairman of the Board through June 30.
|
2015 Grant of Stock Options and PVSUs
| $2,400,021
| ·Target equity award opportunity for serving as Chairman of the Board through June 30 and providing consulting services through December 31, 2015.
·Granted in consideration of his continuance as Chairman of the Board beyond his original retirement date and agreement to provide consulting services during 2015.
·Rewards smooth transition of CEO and Chairman duties.
·PVSU amounts only paid if performance achieved and on terms identical to continuing Company management.
|
Modification of LTIP Awards previously granted
| Permitted continued vesting on same terms as if employed
| ·Modifications align retirement provisions with those grants made in 2014 and later, when the Compensation Committee adopted continued vesting for all officers and are consistent with the intent of the original awards.
|
Company Automobile
| $97,496
| ·Consideration for release, cooperation covenant, continuing past his original retirement date and consulting services after June 30.
|
Pay Mix
| | |
| | |
Our compensation philosophy is to put the greatest emphasis on creating long-term shareholder value. Therefore, the largest percentage of an NEO’s pay is awarded under our long-term incentive plan (split equally between options and performance shares). Excluding Mr. Green’s one-time retention grants, approximately 54.8% of Mr. Green’s Total Direct Compensation (“TDC”), which is the sum of his base salary, short-term incentives and long-term incentives, is based upon long-term
| | value creation, and the remainder of his pay is divided equally among salary and short-term incentives. In addition, 87.5% of Mr. Green’s retention grant of $4,000,000 is a long-term incentive made up of options and stock vesting over 5 years. For our other executives, approximately 44.7% of their pay is based upon long-term awards. Consistent with market practices, a larger portion of their pay mix is salary, but it is still less than one-third of their TDC.
|
2016 Annual Meeting and Proxy Statement | 31
Table of Contents
EXECUTIVE COMPENSATION
| 
|
base salary or incentive pay targets.
20152016 Continuing NEO Base Salaries, Annual Incentive Plan Target,
Long-Term ExpectedGrant Date Fair Value and Incentive Compensation (1)
Name | | Salary as of
1/1/15 or Start
Date, if later | | Salary as of
12/31/15 (2) | | %
Increase | | AIP Target
as % of
Salary | | Long-Term
Grant Date
Fair Value | | Total Direct
Compensation
Percentile (3) | | | Salary as of
1/1/16 | | Salary as of
12/31/16 (1) | | %
Increase | | AIP Target
as % of
Salary | | Long-Term
Grant Date
Fair Value | | Total Direct
Compensation
Percentile (2) | |
Eric M. Green (4) | | $700,000 | | $700,000 | | N/A | | 100% | | $1,700,000 | | 24% | | | $ | 700,000 | | $ | 775,000 | | 10.7 | % | 100 | % | $ | 2,000,000 | | 30 | % |
William J. Federici | | 488,013 | | 502,653 | | 3.0% | | 70% | | 700,000 | | 36% | | | 502,653 | | 525,000 | | 4.4 | % | 75 | % | 700,000 | | 56 | % |
John E. Paproski | | 353,656 | | 364,266 | | 3.0% | | 70% | | 600,000 | | 65% | | |
Karen A. Flynn | | 400,000 | | 420,768 | | 2.0% | | 70% | | 600,000 | | 44% | | | 420,768 | | $ | 450,000 | | 6.9 | % | 70 | % | 700,000 | | 51 | % |
George L. Miller (5) | | 400,000 | | 400,000 | | N/A | | 65% | | 400,000 | | 54% | | |
George L. Miller | | | 400,000 | | 400,000 | | N/A | | 65 | % | 400,000 | | 68 | % |
Annette F. Favorite | | | 300,000 | | 300,000 | | N/A | | 60 | % | 300,000 | | 46 | % |
|
(1) As Dr. Morel retired effective June 30, 2015 and did not receive an increase in compensation, we have not included him on this table.
(2)All NEO salary increases for incumbents were effective May 2015.2016.
(3)(2) TDC ofis base salary plus annual bonus target andplus long-term value. PercentagesBoth Talent Market and Business Segment group data are reviewed for all executives, where available. For purposes of this chart, percentages are based on the Business Segment Comparator Group for Mr. Green and Mr. Federici, andFederici. For all other NEOs the Broad Talent Comparator group for the other NEOs. We also considered the Broad Talent Comparator Group when determining Mr. Federici’s compensation as the Business Segment Comparator Group had a few new hires and other extraordinary circumstances that increased pay. Mr. Federici was in the 53rdTDC percentile of the Business Segment Comparator Group.
(4)Mr. Green’s compensation is based upon histhe Talent Market Group.
Pay Mix
Our compensation forphilosophy is to put the currentgreatest emphasis on creating long-term shareholder value. Therefore, the largest percentage of an NEO’s pay is awarded under our long-term incentive plan (split equally between options and performance period. He also received an LTIP grant for the previous performance period with a grant date fair valueshares). Approximately 56% of $1,150,000 and a retention award of cash, stock and options totaling $4,000,000. These special one-time awards were not included in determining his TDC.
(5)Mr. Miller’s compensationGreen’s TDC is based upon long-term value creation, and the remainder of his compensation for the current performance period. He also received an LTIP grant for the previous performance periodpay is divided equally among salary and short-term incentives. For our other executives, approximately 45% of their pay is based upon long-term awards. Consistent with market practices, a grant date fair valuelarger portion of $200,000 and a retention awardtheir pay mix is salary, but it is still less than one-third of restricted stock totaling $400,000. These special one-time awards were not included in determining histheir TDC.
Our Annual Incentive Compensation Program
Plan Criteria and Rationale The annual incentives for all AIP participants, including the NEOs, are based on our financial performance as a whole measured by adjusted diluted EPS and adjusted operating cash flow.
AIP payouts for PDS and PPS divisional participants (led by Mr. Paproski and Ms. Flynn, respectively) rely on achieving divisional net sales, operating profit and cash flow targets, adjusted to reflect budget exchange rates.
In 2015, as in past years, the Committee evaluated and decided upon the appropriate AIP financial measures using the following principles:
· Metrics must support achievement of an annual Board-approved operating plan;
· Metrics must support profitable growth while preserving cash for longer-term investment;
· Metrics must provide a clear line of sight—i.e., that are clearly understood and can be affected by the performance of our executives and employees; and
| | · Metrics should be consistent with market practice and used within our comparator group.
Following this review, the Committee concluded that the continued use of the AIP financial measures support the foregoing principles for the following reasons:
· EPS is a comprehensive measure of income and provides an emphasis on profitable growth while focusing managers on expense control.
· Operating cash flow provides a focus on generating cash in the short term to fund operations, research and longer-term capital projects and focuses managers on expense control.
· Divisional cash flow, sales and operating profit provide line of sight for operating managers and encourage cooperation among the various regions and business platforms.
Our AIP targets for NEOs are global, rather than regional, reflecting the growing globalization of our business and the expectations of our customers that the Company acts as a single company. These targets help to foster cooperation among our regions and provide a greater incentive to increase divisional revenue and profit without focusing on the impact on any particular region.
|
2016 Annual MeetingThe annual incentives for all AIP participants are based on our financial performance as a whole measured by Adjusted Diluted EPS, Adjusted Revenue and Proxy Statement | 32Adjusted OCF.
Table of ContentsIn 2016, as in past years, the Committee evaluated and decided upon the appropriate AIP financial measures using the following principles:
EXECUTIVE COMPENSATION
· Metrics must support achievement of an annual Board-approved operating plan; | 
|
· Metrics must support profitable growth while preserving cash for longer-term investment;
· Metrics must provide a clear line of sight—i.e., that are clearly understood and can be affected by the performance of our executives and employees; and
· Metrics should be consistent with market practice and used within our comparator group.
Following this review, the Committee concluded that the continued use of the AIP financial measures supports the foregoing principles for the following reasons:
· EPS is a comprehensive measure of income and provides an emphasis on profitable growth while focusing managers on expense control.
· Consolidated revenue provides a clear line of sight target for all members of our executive officer team as we strive to grow our sales to meet increasing demand for our products, particularly high-value products.
· OCF provides a focus on generating cash in the short term to fund operations, research and capital projects and focuses managers on expense control.
Our AIP targets for NEOs are global, rather than regional, reflecting the growing globalization of our business and the expectations of our customers that the Company acts as a single enterprise.
Target Setting
The target annual incentive awards for our NEOs are set as a percentage of base salary. Target awards are reviewed annually to ensure alignment with our compensation philosophy to target each compensation element and total direct compensation at the market median. Variances from this goal are based on an evaluation of competitive market data, internal equity considerations among the CEO’s direct reports and individual performance evaluations.
For 2015, target annual incentive opportunities for the NEOs ranged from 70% to 100% of their year-end base salary rate. Mr. Miller commenced employment on November 19 with a target bonus set at 65% of his year-end base salary rate. Given that Mr. Miller started after November 15, under the terms of our AIP, he was ineligible to receive a payout for 2015.
The payout curve is structured to reflect our philosophy that management should be rewarded
| | for exceeding goals and with diminished payouts, ultimately to zero, when targets are missed.
The payout factor is a pre-established multiplier that corresponds, on a sliding scale, to the percentage achievement of the AIP target objective so that if actual performance is less than target, the multiplier decreases on a sliding scale based on the percentage achievement.
Thus, for example, at the 85% achievement level, officers would receive 50% of their target award. No payouts would be made if actual financial performance falls below 85% of the target level. If AIP targets are exceeded, the multiplier increases on a sliding scale up to the 150% of target award level for achievement of 115% of the performance target level. Achievement between the threshold and maximum levels is straight-line interpolated.
|
| | |
| | |
Financial Results for AIP Purposes
The Committee set the AIP targets based on its evaluation of the 2015 business operating plan and its assessment that the targets contained a sufficient degree of “stretch.” Our performance level for all metrics, except PDS operating profit, was 97.6% or greater. PDS operating profit, which is weighted 5% for Mr. Paproski only,
| | was at the 71.8% level and no payout resulted from that metric. Therefore, payouts were in the 106.9 to 127.1% range. This demonstrates our link between pay and short-term performance. The higher payouts reflect that superior performance was achieved during 2015.
|
| | |
2016 Annual MeetingVariances from this goal are based on an evaluation of competitive market data, internal equity considerations among the CEO’s direct reports and Proxy Statement | 33
Table of Contents
| EXECUTIVE COMPENSATION
| 
|
individual performance evaluations.
For 2016, target annual incentive opportunities for the NEOs ranged from 60% to 100% of their year-end base salary rate. As noted above, we increased Mr. Federici’s target by 5% to 75% to reflect market trends and his responsibilities. Our payout curve is structured to reflect our philosophy that Management should be rewarded for exceeding goals and with diminished payouts, ultimately to zero, when targets are missed.
The payout factor is a pre-established multiplier that corresponds, on a sliding scale, to the achievement percentage of the AIP target objective so that if actual performance is less than target, the multiplier decreases on a sliding scale based on the achievement percentage and is based on the following chart.
Achievement
% | | Payout
factor | |
>85 | % | 0.0 | % |
85 | % | 50.0 | % |
95 | % | 83.3 | % |
100 | % | 100.0 | % |
105 | % | 116.7 | % |
110 | % | 133.3 | % |
115 | %+ | 150.0 | % |
Achievement between the threshold and maximum levels is straight-line interpolated.
Financial Results for AIP Purposes
The Committee set the AIP performance targets based on its evaluation of the 2016 business operating plan and its assessment that the targets contained a sufficient degree of “stretch.” Our 2016 actual performance level for all metrics was 85.3% or greater. The metrics used for all our NEOs (but not all of our officers) were identical. However, given Ms. Flynn’s position as commercial leader and her responsibilities for contract manufacturing, her goals were more heavily weighted on Adjusted Revenue. Payouts were 95.3% for all NEOs except Ms. Flynn who was at 98.4%, because our Adjusted Revenue performed at 102.3% of target. This demonstrates our focus and structured link between business alignment, pay and short-term performance.
20152016 AIP Corporate and Division
Performance Metrics, Weight, Achievement and AchievementPayout Percentages
| | Metric | Financial Objectives | |
Plan Unit and NEO Participants | | Weight | Threshold | Target | Maximum | Results | % of Target |
Corporate Unit:
(Green, Federici, Morel) | | | | | | | |
Adjusted Diluted EPS (1) | | 80% | 1.60 | 1.88 | 2.16 | 2.02 | 107.4 |
Adj. Operating Cash Flow (2) | | 20% | 186.6 | 219.5 | 252.4 | 243.6 | 111.0 |
| | | | | | | |
Packaging Systems Unit:
(Flynn) | | | | | | | |
Adjusted Diluted EPS (1) | | 40% | 1.60 | 1.88 | 2.16 | 2.02 | 107.4 |
Division Metrics (60% of total) – | | | | | | | |
Adjusted Net Sales (3) | | 15% | 901.0 | 1,060.0 | 1,219.0 | 1,074.5 | 101.4 |
Adjusted Operating Profit (3) | | 30% | 199.2 | 234.4 | 269.6 | 253.2 | 108.0 |
Adjusted Divisional Cash Flow (3) | | 15% | 241.8 | 284.5 | 327.2 | 304.6 | 107.1 |
| | | | | | | |
Delivery Systems Unit:
(Paproski) | | | | | | | |
Adjusted Diluted EPS (1) | | 40% | 1.60 | 1.88 | 2.16 | 2.02 | 107.4 |
Division Metrics (60% of total) – | | | | | | | |
Adjusted Net Sales (3) | | 5% | 358.5 | 421.8 | 485.1 | 411.8 | 97.6 |
Adjusted Operating Profit (3) | | 5% | 16.5 | 19.4 | 22.3 | 13.9 | 71.8 |
Innovation Milestones (4) | | 50% | | | | | 104.8 |
| | | | | | | |
| | Metric Weight | | Financial Objectives | | | | | |
Performance Metric | | NEOs (other
than Ms. Flynn) | | Ms. Flynn
only | | Threshold | | Target | | Maximum | | Results | | Achievement
% of Target | | Payout
Percentage | |
Adjusted Diluted EPS (1) | | 60 | % | 45 | % | $ | 1.85 | | $ | 2.18 | | $ | 2.51 | | 2.22 | | 101.8 | % | 106.0 | % |
Adjusted Revenue (2) | | 20 | % | 40 | % | 1,269.5 | | 1,493.5 | | 1,717.5 | | 1,527.1 | | 102.3 | % | 107.7 | % |
Adjusted OCF (3) | | 20 | % | 15 | % | 222.5 | | 261.8 | | 301.1 | | 223.3 | | 85.3 | % | 51.0 | % |
| | | | | | | | | | | | | | | | | | | | |
(1) Adjusted dilutedDiluted EPS for annual incentive purposes is based on budgeted foreign exchange rates and excludes restructuring and certain non-recurring items. Therefore, they differ from the comparable U.S. GAAP measures. See “Financial Measures” for a reconciliation of U.S. GAAP diluted EPS to adjusted dilutedAdjusted Diluted EPS for annual incentive purposes.
(2) Adjusted operating cash flowRevenue is based on budgeted foreign exchange rates. See “Financial Measures” for a reconciliation of the comparable U.S. GAAP financial measures to the adjusted measures for annual incentive purposes.
(3) Adjusted OCF for annual incentive purposes is based on budgeted foreign exchange rates and excludes certain non-recurring items. See “Financial Measures” for a reconciliation of U.S. GAAP operating cash flow to adjusted operating cash flow.
(3)�� Divisional adjusted net sales and adjusted operating profit are based on budgeted foreign exchange rates. See “Financial Measures” for a reconciliation of the comparable U.S. GAAP financial measures to the adjusted divisional financial measures for annual incentive purposes.
(4)A portion of Mr. Paproski’s AIP payout is based upon the achievement of certain innovation product development milestones, which are reviewed and approved by senior management. The Board and its Committees also reviewed and approved the achievement for these milestones.Adjusted OCF.
20152016 AIP Threshold, Target, Maximum and Actual Payouts and Achievement
Name (1) | 2015 Target
Award
(% of Base Salary) | 2015 Threshold
Award (50% of
Target Award)
($) | 2015 Target
Award (100% of
Target Award)
($) | 2015 Maximum
Award (150% of
Target Award)
($) | 2015 Actual
Award
($) | Actual
Achievement
% of Target | |
Name | | | 2016 Target
Award
(% of Base Salary) | | 2016 Threshold
Award (50% of
Target Award)
($) | | 2016 Target
Award (100% of
Target Award)
($) | | 2016 Maximum
Award (150% of
Target Award)
($) | | 2016 Actual
Award
($) | | Actual
Achievement
% of Target | |
Eric M. Green (2) | 100.0% | 241,500 | 483,000 | 724,500 | 614,259 | 127.1% | | 100 | % | 387,500 | | 775,000 | | 1,162,500 | | 738,575 | | 95.3 | % |
William J. Federici | 70.0% | 175,929 | 351,857 | 527,786 | 447,210 | 127.1% | | 75 | % | 196,875 | | 393,750 | | 590,625 | | 375,244 | | 95.3 | % |
John E. Paproski | 70.0% | 127,493 | 254,986 | 382,479 | 272,580 | 106.9% | |
Karen A. Flynn | 70.0% | 147,269 | 294,538 | 441,807 | 359,630 | 122.1% | | 70 | % | 157,500 | | 315,000 | | 472,500 | | 309,960 | | 98.4 | % |
Donald E. Morel, Jr. (3) | 100.0% | 211,413 | 422,827 | 634,240 | 537,413 | 127.1% | |
George L. Miller | | | 65 | % | 130,000 | | 260,000 | | 390,000 | | 247,780 | | 95.3 | % |
Annette F. Favorite | | | 60 | % | 90,000 | | 180,000 | | 270,000 | | 171,540 | | 95.3 | % |
(1)Mr. Miller did not receive an AIP award for 2015 due to his start date being after November 15, 2015, the Plan’s cut-off date for eligibility.
(2)Mr. Green’s AIP payout is prorated at 69% based on his start date. All calculations take this proration into consideration.
(3)As a result of his retirement effective June 30, 2015, Dr. Morel will receive 50% of his AIP payout. All calculations take this pro ration into consideration.
2016 Annual Meeting and Proxy Statement | 34
Table of Contents
| EXECUTIVE COMPENSATION
| 
|
Our Long-Term Equity Incentive Program
Plan Criteria and Rationale
Long-term compensation for all our executives, including our NEOs, is entirely equity based. Our long-term awards are structured to align our executives’ interests with those of our shareholders and to emphasize the Committee’s expectation that our executive officers should focus their efforts on growing our business while carefully managing capital.
To help further these objectives, we use Compound Annual Growth in RevenueCAGR and Return on Invested CapitalROIC as the performance measures for determining PVSUPSU payouts. Each
metric is weighted equally because we believe CAGR and ROIC are equally important in creating shareholder value.
The use of stock options is intended to align our executives’ longer-term interests with those of our shareholders because options gaindeliver value to the executive only when and to the extent that share price exceeds the exercise price of the option. Therefore, options provide a strong performance-based link between shareholder value and executive pay.
Performance-VestingPerformance Share Units
The number of shares that may be earned under the PVSUsPSUs is based on achievement of CAGR and ROIC targets. Each PVSUPSU award agreement contains a target payout for the recipient. The number of shares an executive earns at the end of a performance period is calculated by multiplying the target number of PVSUsPSUs awarded at the beginning of the period times the applicable “payout factor” for each performance metric times the weighting for that performance metric.
Target PVSUs PSUs
(i.e., number of shares to be earned if
performance equals 100% target) | x | Payout Factor
(based on achievement against
CAGR and ROIC targets)
| x | Weighting
(50% for each
metric)
| = | Number of
Shares Earned |
20152016 Long-Term Equity Awards
In 2015,2016, long-term incentive plan participants, including our NEOs, received a grant of PVSUsPSUs and a grant of non-qualified stock options. The total expected grant value was divided equally between the two forms of awards. Expected grant value is the target opportunity valued as the accounting fair value. Actual or realized value of these awards in future years can and will vary from this target opportunity based on share price, ROIC and CAGR performance over time.
The total award value of each NEO was targeted to the market median as represented by comparator group data, as well as relative duties and responsibilities, advancement potential, and each NEO’s impact on our financial results.
Additionally, during 2015, each of our two newly-hired NEOs, Mr. Green and Mr. Miller,
received an additional pro rata LTIP award of PVSUs and stock option grants. Each partial cycle award is based on the 2014-2016 performance period, was targeted at approximately 67% of the value of the awards for the full performance period and will vest in accordance with the performance conditions set at the time of the original award in 2014.
Therefore, the options granted were immediately 25% vested and vesting continues in accordance with the schedule applicable to all participants who were employed during 2014. These awards were made to ensure both Mr. Green and Mr. Miller are incentivized to achieve the goals set forth for that particular performance period, the achievement of which, in the reasonable discretion of the Committee, will add significant shareholder value. The PVSUs granted are measured based upon the CAGR and ROIC performance goals and targets approved for the 2014-2016 performance period, which were
2016 Annual Meeting and Proxy Statement | 35
identical to the 2015-2017 performance period. The option exercise price and Black-Scholes value were established as of the NEO’s startlong-term incentive plan grant date for options. In accordance with our grant document and policies, no discounted options were awarded.
The grantfair values are shown in the following table. The 2014-16 and 2015-17 PVSU2016-18 PSU threshold, target and maximum CAGR and ROIC goals follow.immediately follow that table.
20152016 Long-Term Equity Award Grant Date Fair Value at Time of Grant
Name | PVSUs (1) 2014-2016
Performance Period
($) | Stock Options
Vesting thru
February 2018 (1) ($) | PVSUs (1) 2015-2017
Performance Period
($) | Stock Options
Vesting thru
February 2019 (2) ($) | Total Award Value ($) | | Performance Stock Units (1)
($) | | Stock Options (2)
($) | | Total Award Value
($) | |
Eric M. Green | 574,948 | 575,057 | 849,570 | 850,000 | 2,849,575 | | 999,984 | | 1,000,020 | | 2,000,004 | |
William J. Federici | N/A | 350,015 | 350,006 | 700,021 | | 350,027 | | 350,005 | | 700,032 | |
John E. Paproski | N/A | 299,990 | 299,994 | 599,984 | |
Karen A. Flynn | N/A | 299,990 | 299,994 | 599,984 | | 350,027 | | 350,005 | | 700,032 | |
George L. Miller | 100,054 | 99,979 | 199,983 | 200,009 | 600,025 | | 299,989 | | 300,011 | | 600,000 | |
Donald E. Morel, Jr. | N/A | 1,199,991 | 1,200,030 | 2,400,021 | |
Annette F. Favorite | | | 149,995 | | 150,028 | | 300,023 | |
(1) The grant date fair value of PVSUsPSUs is based on a grant date fair value of $54.14$59.64 per share on February 23, 20152016 with respect to Mr. Federici, Mr. Paproski and Ms. Flynn, $57.38 on April 24, 2015 with respect to Mr. Green, $58.08 on June 30, 2015 with respect to Dr. Morel, and $62.30 per share on November 19, 2015 with respect to Mr. Miller.all NEOs. For the assumptions made in determining grant date fair values, refer to Note 12 to the consolidated financial statements included in our 20152016 Form 10-K.
(2) The grant date fair value of options is based on a grant date fair value of $10.19$11.53 per share on February 23, 20152016 with respect to Mr. Federici, Mr. Paproski and Ms. Flynn’s normal annual award, $10.65 on April 24, 2015 with respect to Mr. Green, $11.63 on June 30, 2015 with respect to Dr. Morel, $10.70 on October 20, 2015 with respect to Ms. Flynn’s special award, and $12.72 per share on November 19, 2015 with respect to Mr. Miller.all NEOs. For the assumptions made in determining grant date fair values, refer to Note 12 to the consolidated financial statements included in our 20152016 Form 10-K.
2014 – 2016 and 2015-172016-18 Performance Period PVSU Goals
PVSUPSU Award Performance Goals
| Metric | Threshold | Target | Maximum | |
| | | | | |
| | | | | |
| ROIC | 7.70% | 11.00% | | 16.50% | |
| CAGR | 5.53% | 7.90% | | 11.85% | |
| | | | | | |
New Hire Awards
Mr. Green. Mr. Green received a $4,000,000 cash and equity award upon his commencement of employment in April 2015 to entice him to join West, to replace a portion of the compensation that he forfeited upon termination from his prior employer, provide immediate alignment with West shareholders through a significant equity stake and serve to retain Mr. Green at West. The award included $500,000 in cash that was paid on the six-month anniversary of his start date (October 2015). The remaining $3,500,000 in value was delivered 50% in restricted stock and 50% in stock options. $2,000,000 of the stock and option award value vests on the third anniversary of his start date and the remaining $1,500,000 vests on the fifth anniversary of his employment start date. To
benefit from those awards, Mr. Green must be employed on the vesting date, have been terminated without cause or must have terminated with good reason – each as defined in his employment agreement. If Mr. Green is terminated without cause, terminates for good reason, dies or becomes disabled, his awards will vest immediately. The cash and equity components were awarded to Mr. Green primarily to replace unvested equity awards and cash severance awards that he forfeited when leaving his former employer, Sigma-Aldrich, which was undergoing a change-in-control. All equity would have vested upon the completion of that change in control and Mr. Green left equal or greater amounts of cash and equity behind due to his departure prior to its completion. The
2016 Annual Meeting and Proxy Statement | 36
Metric | | Threshold | | Target | | Maximum | |
ROIC | | 8.61 | % | 12.30 | % | 18.45 | % |
CAGR | | 6.86 | % | 9.80 | % | 14.70 | % |
Table of Contents
| EXECUTIVE COMPENSATION
| 
|
Committee determined it was in the best interests of West to have Mr. Green start employment before our 2015 Annual Meeting, and, therefore, did not want to wait for the sale transaction at Sigma-Aldrich to close.
In determining the value and form of these awards, the Compensation Committee considered and discussed standard practices together with Pay Governance.
Mr. Miller. Mr. Miller was granted a $400,000 restricted stock award. This award vests 100% on the fourth anniversary of his start date on the same terms and conditions as apply to Mr. Green’s new hire grants. As with Mr. Green, Mr. Miller’s award was made to entice him to join West to provide immediate alignment with West shareholders through a significant equity stake and to serve to retain Mr. Miller at West.
Equity Award Grant Practices
Under the Committee’s equity-based awards policy and procedures, equity awards normally are made once per year at the Committee’s meeting in February. The Company’s policy on equity grants contains rules on determining (1) the grant date of equity awards (at least two business days following the release of our annual results for the preceding fiscal year) and (2) the exercise price of stock options granted by the Committee (which must be at least equal to the fair market valueclosing price of our stock on the grant date).
The policy also delegates authority to a managementManagement committee to make a limited number of grants to managementManagement below the officer level in connection with the hiring or promotion of employees or for retention purposes, which may occur throughout the year.
During 2015, after benchmarking similar practices at the Company’s Comparator Groups, the Committee did not change the expected LTIP values for any continuing executives. Newly-hired executives were benchmarked against the Company’s Comparator Groups at the time of hire and are discussed below. Expected values are the targeted accounting grant date fair value, but actual payouts will vary with ROIC and CAGR performance as well as share price. We also discuss the awards to Dr. Morel in more detail below.
Mr. Green. The Committee concluded that the appropriate value of equity to be granted to Mr. Green in his first year with the Company, based on his experience level and market practices, was $1,700,000. Mr. Green’s pay mix is similar to
that of Dr. Morel, but the expected value is less than Dr. Morel’s, to reflect Mr. Green’s fewer years of experience and the fact that he is also not Chairman of the Board. As noted above, Mr. Green was given an additional award for the 2014-16 performance period that was approximately 67% of his 2015-17 award. This award was granted to ensure Mr. Green’s commitment to carrying out the important financial goals established by the Company before 2015, but not completed until 2016 and also, to provide additional stock ownership to increase his alignment with shareholders during the performance period.
Mr. Miller. The Committee concluded the appropriate value for Mr. Miller in his first year with the Company and based on his significant years of experience and his additional duties as General Counsel, Compliance Officer and Corporate Secretary as well as having responsibility for environmental, health and safety and corporate citizenship, is an expected value of $600,000. As with Mr. Green, and based on the same rationale, Mr. Miller received an award for the 2014-2016 performance period equal to approximately 67% of the value of his award for the 2015-17 period.
Dr. Morel. In connection with the Retirement Separation Agreement entered into with Dr. Morel, the Committee granted him an LTIP award with an expected value of $2,400,000, which is consistent with those he received in prior years. The Retirement Separation Agreement and rationale for the award is discussed on page 30.
2016 Annual Meeting and Proxy Statement | 37
The following tables show the performance against targets for the three-year PVSUPSU performance period ending December 31, 2015,2016, and the actual award values for each eligible NEO. Though Mr. Green, Mr. Miller and Ms. Favorite were not eligible during the beginning of the performance period, they received pro rata PSU awards for that period based on their hire date and in a manner consistent with our past practices and discussed in our previous proxy statements with regard to Mr. Green and Mr. MillerMiller. Ms. Favorite’s new hire awards were not eligible for 2013-15 PVSU awards and, therefore, did not receive a payout.made based on the same rationale. During the three-year period from 2013-2015,2014-2016, our performance as measured by CAGR and ROIC
significantly exceeded did not meet our targets and the performance of many of our peer groups, and the S&P 500 when measured by TSR.stretch goals. Accordingly, the payouts under our long-term plan are higherless than target. ParticipantsHowever, participants in the long-term plan have shared in the appreciation of our stock price to the same extent as our shareholders over the period.period and the paid out values exceed the original grant date fair value (full-term participants received a payout of approximately 168% of the original grant date fair value). This is consistent with our pay-for-performance philosophy as our performance as measured by TSR has been outstanding compared to our Business Segment Group peers over the three-year period with a percentile ranking of 86%. Additionally, our TSR has outpaced the S&P 500 Index for the same three-year period at 77% versus 21% for the broader index.
20132014 – 2015 PVSU2016 PSU Performance Period
Performance/Payout Results
Metric | | Threshold | | Target | | Maximum | | Result | | Performance
as% of Target | | Payout
Factor | | Weighting | | Payout as%
of Target | | Threshold | | Target | | Maximum | | Result | | Performance
as % of Target | | Payout
Factor | | Weighting | | Payout as %
of Target | |
ROIC | | 6.30 | | 9.00 | | 13.50 | | 10.36 | | 115.11 | | 130.22 | | 50% | | 65.11% | | 7.70 | | 11.00 | | 16.50 | | 11.01 | | 100.09 | | 100.18 | | 50 | % | 50.09 | % |
CAGR | | 4.55 | | 6.50 | | 9.75 | | 6.15 | | 94.62 | | 90.98 | | 50% | | 45.49% | | 5.53 | | 7.90 | | 11.85 | | 6.93 | | 87.72 | | 79.45 | | 50 | % | 39.72 | % |
| | | | | | | | | | Final Payout Result as a% of Target: | | 110.60% | | | | | | | | Final Payout Result as a % of Target: | | 89.81 | % |
20132014 – 2015 PVSU2016 PSU Performance Period
Award Payouts by NEO
Name | Target Award at
Grant (1)
(#) | Target Award Value
at Grant (1)
($) | Actual
Award
Shares (2)
(#) | Actual Award
Value at $59.64 (3)
Per Share
($) | | Target Award at
Grant (1)
(#) | | Target Award
Value at Grant (1)
($) | | Actual Award
Shares
(#) | | Actual Award
Value (2)
($) | |
| | | | | |
Eric. M. Green | | | 10,020 | | 574,948 | | 9,110 | | 791,932 | |
William J. Federici | 11,742 | 349,966 | 13,374 | 797,625 | | 7,393 | | 349,985 | | 6,797 | | 590,863 | |
John E. Paproski | 10,012 | 299,999 | 11,374 | 678,345 | |
Karen A. Flynn | 5,076 | 150,021 | 5,767 | 343,944 | | 6,506 | | 300,018 | | 5,967 | | 518,711 | |
Donald E. Morel, Jr. (4) | 40,602 | 1,199,992 | 46,127 | 2,751,014 | |
George L. Miller | | | 1,606 | | 100,054 | | 1,455 | | 126,483 | |
Annette F. Favorite | | | 908 | | 50,022 | | 824 | | 71,630 | |
(1) Target award is based on achievement of 100% of performance metrics and target value is calculated by multiplying the target award by the closing price of our common stock on the award grant date. Mr. Federici and Mr. Paproski received two awards in 2013 – one on February 19, 2013 when the split-adjusted fair market value was $29.56 per share and another on March 26, 2013, when the split-adjusted fair market value was $32.19.dates.
(2) Includes shares credited due to dividend equivalent units.
(3)TheActual award value using $86.93 per share — the closing price of our common stock on February 23, 2016,14, 2017, the award payout date.
(4)Dr. Morel received a payout of his 2013-15 award in accordance with the terms of his Retirement Separation Agreement.
Special Grant to Ms. Flynn
During 2015, the Company engaged in a robust enterprise strategic planning process to assess our strategies over the next five years and beyond. A team was selected from various business units and levels of the organization. These individuals spent more than three months creating a recommendation for an enhanced strategic plan in addition to their normal duties. Each member of the team received an option grant upon approval of the Board of the new enterprise strategic plan to reward them for their efforts, and provide greater incentives to them to be champions of the revised enterprise
strategic plan, which is intended to drive long-term shareholder value. Mr. Green appointed Ms. Flynn to lead this team. In recognition of her extraordinary efforts as the team leader, the Compensation Committee approved a one-time additional equity grant of 2,500 options on October 20, 2015, with an exercise price of $55.42, vesting 25% per year and having a 10-year expiration term. The expected value of this award is $26,750, based on the Black-Scholes value of $10.70 per share on the grant date.
2016 Annual Meeting and Proxy Statement | 38
Table of Contents
EXECUTIVE COMPENSATION
| 
|
Part 2 –Part 2 — Compensation Framework
|
Compensation Philosophy and Objectives
Our compensation philosophy is to provide competitive executive pay opportunities tied to our short-term and long-term success. This overriding pay-for-performance approach enables us to attract, motivate and retain the type of executive leadership that will help us achieve our strategic objectives and realize increased shareholder value. To reach these goals, we have adopted the following program objectives:
· Have a strong pay-for-performance element with a major portion of executive pay “at risk” based on achievement of financial performance goals.
· Support achievement of both operating performance and strategic objectives.
· Link managementManagement compensation with the interests of shareholders.
· Be fair and market-competitive to assure access to needed talent and encourage retention.
· Provide compensation opportunities that are consistent with each executive’s responsibilities, experience and performance.
· Design compensation incentive programs that promote a sensible risk/reward balance, and that do not encourage unnecessary or unreasonable risk-taking.
· Use perquisites sparingly, which has led to the reduction of available perquisites over time, including the phase out, beginning in 2014, of automobile allowances.
Applying our Compensation Philosophy The automobile phase out was completed prior to 2016. The only perquisite available to executives in 2016 was relocation benefits, which generally are available to salaried employees on similar terms.
We apply our compensation philosophy and objectives through the compensation components as follows:discussed above on page 20, under “Executive Compensation Elements.”
Compensation Component
| Objectives
|
Base Salary
| Fair and competitive compensation to attract, retain and reward executive officers by providing a fixed level of cash compensation tied to experience, skills and capability relative to the market.
|
Annual Incentive Award
| At-risk cash bonuses focus NEOs on annual results by rewarding them for achieving key budgeted financial targets.
Competitive Positioning Links interests of NEOs with those of shareholders by promoting strong profitable growth.
Helps retain NEOs by providing market-competitive compensation.
|
2016 Annual Meeting and Proxy Statement | 39
Table of Contents
EXECUTIVE COMPENSATION
| 
|
Compensation Component
| Objectives
|
Long-Term Incentive Award (PVSUs and Stock Options)
| At-risk long-term compensation aligns interests of NEOs with those of shareholders by linking compensation with long-term corporate performance that benefits our shareholders.
Retains NEOs through multi-year PVSU performance period and stock option vesting.
Promotes a sensible balance of risk and reward, without encouraging unnecessary or unreasonable risk-taking.
|
Retention Awards
(Restricted Stock, Stock Options and Cash)
| Attracts talented executives who forgo compensation from prior employer.
Provides a retention tool for new and ongoing executives and incentive to increase the value of our stock.
|
Retirement Plan and Non-Qualified Deferred Compensation Plan
| Attracts and retains NEOs by providing a level of retirement income and retirement savings in a tax-efficient manner.
|
Competitive Positioning
In support of our compensation philosophy, we target the median compensation values of two compensation comparator groups, – awhich we refer to as the “Business Segment Comparator Group” and a “Broad Talent Comparatorthe “Talent Market Group.” The Business Segment Comparator Group is composed of public companies with operational and customer characteristics similar to our own. The Broad Talent ComparatorMarket Group is a size-appropriate sample of companies that participate in the Willis Towers Watson annual executive compensation database with annual revenues between $500 milliona pre-determined range that is similar to our own and $3 billion and thatwhich operate in industries that are similar, but not identical to our own industry. Generally, the chemicals, electronicsTalent Market Group is larger and scientific equipment, healthcare/medical products, industrial manufacturingbroader than the Business Segment Group and approximates the markets in which we compete for talent or pharmaceuticals industries.
where the talent available would have similar characteristics to our own. The Business Segment Comparator Group includes public companies with similar business operations, size, scope and complexity and is designed to provide an industry perspective to balance with the Talent Market Group.
Data from both the Business Segment Group (where sufficient data are available) and Talent
Market Group are used primarily to determine competitive pay practices andfor all our executive officers in a balanced manner. Data from the Business Segment Group are used to review compensation design details as well asand make CEO pay-for-performance comparisons for our CEO and CFO because data is available from SEC filings each year. If data for other positions is available, we would also use this group to benchmark compensation.comparisons.
The companies in the Business Segment Comparator Group are initially identified by Pay Governance and then approved by the Committee with input by Management based on the following criteria: (1) size (approximately one-half to two times our annual revenues); (2) industry (healthcare(healthcare equipment/supplies, industrial machinerymanufacturing and life sciences tools/services); and (3) operating structure (globalsuch as:
· global footprint with multi-plant manufacturing capabilities,
capabilities,
· similar raw materials and products (elastomers, plastics, metals), and similar intellectual property profileprofile; and,
· similar customer characteristics)characteristics (complex sales cycle, quality requirements, regulatory requirements).
The Broad Talent ComparatorMarket Group provides us with an additional consistent set of market data for all of our executive positions, representing a sample of companies with which we broadly compete for talent. It is a secondaryan additional comparator group for our CEO and CFO and, a primarygenerally, the main comparator group for our other officer positions. The companies in the Broad Talent ComparatorMarket Group can change each year based on survey participation; however, noparticipation, and, if the Compensation Committee deems necessary, due to changes in the applicable criteria. As discussed below, the Committee made prospective changes to the parameters used to select the group were required in 2015.these criteria during 2016 that are applicable for 2017.
Given our size and business portfolio, it is challenging to identify a robust sample of appropriate market compensation peers that fit conventional criteria; there is no company that matches ours completely. We believe that using a balance of business segment and talent market references that reflect companies with which we compete for business and capital, and more broadly, those with which we compete for talent, provides the Committee with decision-quality data and context, and is a reasonable representation of our labor market for executive talent.
This multi-group, talent and business-oriented approach has met our historic needs and provides a broad context for evaluating compensation levels and practices. However, the Committee believes it is very important to refresh the approach when it deems necessary to reflect (1) our changing enterprise strategy, (2) the markets in which we compete for business, including emerging or more technical markets, (3) the areas in which we compete for talent and the characteristics we expect from the talent we are seeking as we build a more robust market-led organization, and (4) our increasing size, complexity and the globalization and harmonization of our business processes.
The Committee annually evaluates and, ifwhen it deems appropriate, updates the composition of the both comparator groups. In 2015,2016, we undertook a much deeper review given changes in our Management and enterprise strategy. Regarding the Business Segment Group, Management was asked to consider several additions for companies that had similar revenue size, were global, had a healthcare focus and similar peer groups to our own. As a result of this review, Management recommended the inclusion of Catalent, Inc., Halyard Health, Inc. and Teleflex Incorporated. The Committee evaluated potential additions to both groupsagreed that each of the recommended companies competed in a market consistent with our strategic direction and determined no changes were necessary.
2016 Annual Meeting and Proxy Statement | 40
Table of Contents
EXECUTIVE COMPENSATION
| 
|
Theto include them as Business Segment comparators for setting of compensation and Broad Talent Comparator Groupspay-for-performance practices after October 2016. Prior to that date, we used in 2015 consisted of the following companies:
2015previously-approved Business Segment ComparatorGroup.
Business Segment Group (1)
Aptar Group, Inc. | DENTSPLY International Inc. | Haemonetics Corporation | ResMed Inc. |
CONMED Corporation | Edwards Lifesciences Corp. | IDEXX Laboratories, Inc. | Steris Corp. |
The Cooper Companies Inc. | Gerresheimer AG | Invacare Corporation | Varian Medical Systems |
C.R. Bard | Greatbatch, Inc. (renamed Integer Holdings) | Pall Corporation | |
2015 Broad Talent Comparator Group(1) Amended to include Catalent, Inc., Halyard Health, Inc. and Teleflex Incorporated for 2016 pay-for-performance analyses and 2017 compensation decisions.
A.O. Smith Corporation
Management and the Compensation Committee also carefully reviewed the criteria used for determining the Talent Market Group. Previously, the Talent Market Group included global companies in the chemical, electronic, electrical and scientific equipment; healthcare/medical; industrial manufacturing and pharmaceutical industries. Upon discussion with Pay Governance, Management recommended removing the industrial manufacturing segment from the Talent Market Group because this group represented a large number of constituents in the Talent Market Group but did not align as closely as the other sub-groups with our future strategic direction, past revenue growth and expected future revenue growth. In particular, Management wanted to ensure the companies in this group are sufficiently technical and science-based manufacturers, unlike general industrial manufacturing. Additionally, to make sure that the sample size was robust enough, to reflect our increasing revenue and consistent with market practices, Management recommended an increase of the top range of revenue for this group from $3.5 billion to $4.0 billion. This increase in revenue also brought into scope a few direct comparators. The Committee approved these changes for 2017 compensation decisions. Prior to that date, we used the previously approved Talent Market criteria. Unlike the Business Segment Group, the Compensation Committee does not select individual members of the Talent Market Group. Rather, the Committee evaluates and selects objective criteria and relies upon the companies that participate in the Willis Towers Watson survey, which change annually. Therefore, the individual companies comprising the survey data are not considered by the Committee, and the Committee does not consider the identity of these companies to be material. | Dematic Corporation
| Knowles Corporation
| Purdue Pharma L.P.
|
Accelent Inc.
| DENTSPLY International
| Lincoln Electric Holdings, Inc.
| Quaker Chemical Corporation
|
Advanced Drainage Systems Inc.
| Donaldson Company, Inc.
| Makino Milling Machine Co. Ltd.
| Regeneron Pharmaceuticals Inc.
|
Alexion Pharmaceuticals, Inc.
| Edwards Lifesciences Corp.
| Mallinckrodt Pharmaceuticals
| Savannah River Nuclear Solutions
|
Americas Styrenics LLC
| Endo International
| Matthews International Corp.
| Sensata Technologies, Inc.
|
Amneal Pharmaceutical LLC
| ESCO Corporation
| Milacron Holding Corp.
| ShawCor Ltd.
|
Arctic Cat Inc.
| GAF Materials Corporation
| MTS Systems Corporation
| Sigma-Aldrich Corporation
|
BioMarin Pharmaceutical Inc.
| Graco Inc.
| NuVasive, Inc.
| Tennant Company
|
Calgon Carbon Corporation
| Greatbatch Inc.
| OM Group Inc.
| TimkenSteel Corp
|
Capsugel
| H. B. Fuller Co.
| Oxford Instruments America Inc.
| Toro Company
|
Catalent Inc.
| Icon plc
| Pall Corporation
| TPC Group Inc.
|
Chemtura Corporation
| IDEXX Laboratories, Inc.
| Platform Specialty Products
| Vertex Pharmaceuticals Inc.
|
Chiesi Pharmaceuticals Inc.
| International Flavors & Fragrances, Inc.
| Plexus Corp.
| Worthington Industries, Inc.
|
Covance, Inc.
| Kennametal Inc.
| Polymer Group Inc.
| |
Setting Targets and Performance Goals
The Committee annually reviews the total compensation of each executive officer—i.e., cash compensation (salary and target annual incentive opportunity) and long-term equity compensation (target long-term equity value).
The Committee, with input from its independent compensation consultant, then sets the executive’s compensation target for the current year. Adjustments may be made to short- or long-term incentive award opportunities. Salary adjustments, if any, typically become effective in April or May of each year or upon a promotion. The compensation decision for the CEO is reviewed with and ratified by the independent directors in executive session.
In making its decisions, the Committee uses several resources and tools, including competitive market information, compensation trends within the comparator groups, realizable pay versus performance and the larger executive compensation environment.
The Committee also reviews “tally sheets” for each of our executive officers as one of the tools to help assess the alignment of their pay with our performance and compensation philosophy. The
tally sheets include salary, equity and non-equity incentive compensation, perquisites and the value of compensation that would be paid in various termination scenarios. The tally sheets help the Committee understand the different components of our compensation programs and the interrelationship of these amounts.
For 2015,2016, the Committee set target levels for the financial objectives used in the AIP and for PVSUPSU awards and concluded that there was an appropriate correlation between payout (at target, threshold and maximum) and target performance levels in light of the business environment, risks
associated with achieving our five-year strategic plan and other factors.
During 2015,2016, the Committee again conducted a retrospective look at the difficultlydifficulty of attaining the performance goals established under the long-term and short-term incentive plans. This analysis concluded that the goals were very challenging versus our Business Segment Comparator Group and the historic payouts demonstrated a robust qualitative goal-setting process, which has resulted in a strong pay-for-performance link.
2016 Annual Meeting and Proxy Statement | 41
The Committee works with Pay Governance LLC to look atreview realizable pay granted to the CEO. Realizable pay is calculated using actual bonuses earned, end of period stock values and in-the-money value of stock options granted during the year. It takes a retrospective look at pay versus performance. The analysis showed that there was a high correlation between the
realizable pay earned by our CEO and the Company’s performance as measured by TSR, CAGR, ROIC and similar financial metrics compared to other members in our Business Segment Comparator Group. The Committee determined this analysis confirmed its pay-for-performance philosophy.
Evaluating Individual Performance
The Committee uses its judgment in making decisions about individual compensation elements and total compensation for our NEOs, with a focus on individual performance and
competitive market data. The Committee also considers each NEO’s performance against his or her individual performance objectives, as well as the Company’s overall financial performance.performance and the financial performance of the function or areas of operational responsibility for each NEO.
Post-Employment Compensation Arrangements
Retirement Plans
During 2015,2016, all NEOs participated in our defined benefit and defined contribution retirement programs for U.S.-based employees. In addition to the standard benefits available to all eligible U.S.-based employees, we maintain non-qualified retirement plans in which these executives participate.
All tax-qualified defined benefit plans have a maximum compensation limit and a maximum annual benefit, which limits the benefit to participants whose compensation exceeds these limits. The non-qualified retirement plans offered by the Company provide benefits to key salaried employees, including each NEO, using the same benefit formulas as the tax-qualified plans but without regard to the compensation limits and maximum benefit accruals for tax-qualified plans.
We also provide our NEOs with benefits upon termination in various circumstances, as described under “Estimated Payments Following Termination” and “Payments on Termination in Connection Withwith a Change-in-Control” sections below.
We believe that our existing arrangements help executives remain focused on our business in the event of a threat or occurrence of a change-in-control and encourage them to act in the best interests of the shareholders in assessing and implementing a transaction.
Beginning with agreements entered into after 2010, the Company eliminated excise tax gross-ups and single-triggers under these types of agreements. Therefore, change-in-control agreements with Mr. Green, Ms. Flynn, Mr. Paproski, and Mr. Miller do not include these features. Onlyonly Mr. Federici’s pre-2010 agreement includes an excise tax gross-up.
Certain Payments to Dr. Morel. In June 2015, we agreed to make certaingross-up and permits payment in the event of voluntary termination without good reason. All other agreements include a cutback in payments and awards to Dr. Morelbenefits if the NEO would be in exchange for: (1) service as Chairman of the Board following his retirement as CEO, (2) continued consulting services for the 6-month period following termination as Chairman of the Board, (3) an agreement to cooperate with the Company following termination, (4) a release of claims against the Company, and (5) a non-disparagement provision. Dr. Morel was previously subject to two-year non-competition and non-solicitation covenants.more favorable after-tax position.
Other Compensation Policies
Retention Cash
Occasionally, the Committee pays signing and retention bonuses in cash. These bonuses may have repayment obligations. The amountsprimary purpose of these payments are describedis to replace equity or cash payments granted by a new officer’s former employer and to serve as a retention mechanism for new officers. In 2015, the Committee granted Ms. Favorite a $150,000 retention cash award that was paid in the “Compensation Tables” section of this Proxy Statement and the rationaleApril 2016. This amount is discussedsubject to repayment in more depth above. The Company believes that securing these agreements from Dr. Morel was critical to the ability of the Company to focus on future growth of the Company. The transition services provided by Dr. Morel to Mr. Green
2016 Annual Meeting and Proxy Statement | 42full if Ms. Favorite terminates employment voluntarily or is terminated with cause before October 1, 2020.
ensured a smooth transition in leadership and enabled the Company to continue to grow shareholder value. The covenants contained in this agreement also protect the Company from the prospects of potentially costly litigation and secure future cooperation in the event it is needed.
Additionally, the Company provided one-time, nominal in-kind personal retirement benefits to
Dr. Morel in recognition of his extraordinary contributions to the Company, outstanding 22-years of service, including his tenure as Chief Executive Officer and Chairman of the Board, whereby shareholder value and market capitalization increased by approximately ten times and net sales increased over 300%. These personal benefits are disclosed in the “Compensation Tables” section of this Proxy Statement.
Other Compensation Policies
Share-Ownership Requirements
Share-ownership goals further align an executive’s interests with those of our shareholders and encourage a long-term focus. Within five years of attaining their position, all executive officers must acquire shares of common stock with a value equal to designated multiples of their base salary. The Committee established a goal of six-times base salary for the CEO and two-times base salary for all other executive officers.
Until the goals are reached, executives are required to receive 25% of their annual bonus in shares. All NEOs currently meet or exceed the stock ownership guidelines except Mr. Green, and Mr. Miller. Mr. Green and Mr. Miller and Ms. Favorite. These three NEOs still have four more years (including 2017) to reach the required minimum holding requirement. In the interim, at least 25% of their bonuses will be paid in stock.
We have benchmarked our share ownership requirements against the companies in our Business Segment Comparator Group. Our requirements are generally at least as robust as those of our peers.
Policy on Hedging and Pledging
We prohibit directors, officers and employees from engaging in hedging or monetization transactions, such as zero-cost collars and forward sale contracts, that would allow them to continue to own our common stock, but without the full risks and rewards of ownership. We also prohibit directors, NEOs and other senior employees from engaging in pledging, short sales or other short-position transactions in our common stock.
Personal Benefits
The benefits provided to our NEOs are generally the same as or consistent with those provided to our other salaried employees. We believe these benefits are reasonable and competitive so that we may attract and retain talented employees. In total, these benefits represent a small percentage of each NEO’s overall compensation, and the Committee has reduced or eliminated in recent years many of the benefits that are not provided to our employees more broadly.
We provide a relocation benefit to all our salaried employees who relocate at the request of the Company. This benefit is intended to attract and retain employees by providing them in recent years. with assistance during the moving process.
During 2014, the Committee began phasing out the automobile allowance for U.S.-based executives whose leases were expiring. ThesePrior to 2016, the phase out was completed for all NEOs, and, therefore, no automobile benefits or allowances are reflected in the “All Other Compensation” column of the 2015 Summary Compensation Table.included.
Risk Considerations in Our Compensation Programs
The Committee has reviewed our compensation policies and practices for our officers and employees and concluded that any risks arising from these policies and programs are not reasonably likely to have a material adverse effect on the Company. The Committee believes that the mix and design of the
elements of our compensation program are appropriate and encourage executive officers and key employees to strive to achieve goals that benefit the Company and our shareholders over the long term.
2016 Annual Meeting and Proxy Statement | 43
Our compensation policies and procedures are applied uniformly to all eligible participants. By targeting both company-wide and business-unit performance goals in our annual bonus plans and long-term compensation, we believe we have allocated our compensation between base salary and
short- and long-term target opportunities in a way that does not encourage excessive risk-taking by our employees.
Role of the Compensation Consultant and Executives in Setting Compensation
The Committee approves all compensation decisions for our NEOs, including CEO compensation which decision is made after the Committee consults with theall independent directors in executive session.
The Committee has engaged Pay Governance LLC as its independent consultant to assist the Committee in evaluating our executive compensation.
During 2015, the consultant2016, Pay Governance performed the following tasks for the Committee:
· Prepared competitive market data for the compensation of the executive officer group;
· Prepared analysis of existing compensation and recommendations related to the compensation to be paid to executive officers hired in 2015;2016;
· Assessed performance goal and metrics difficulty;
· Performed modeling to determine the recommendations of shareholder advisory services regarding our 2016 Omnibus Incentive Compensation Plan;
· Reviewed share utilization, dilution and overhang issues;
·Updated the Committee on executive compensation trends and regulatory developments;
· Prepared a realizable pay analysis for the CEO;
· Provided input on the Committee’s executive officer pay recommendations;
· Assisted with the Company’s review of our comparator groups to ensure it reflected our updated enterprise strategy, long-term goals and the markets in which we compete in for talent and business; and,
·Provided input on compensation program design, tally sheets and philosophy and incentive-pay mix and comparator groups against which executive pay is benchmarked; and
·Prepared market data regarding vesting of equity upon retirement of executives.mix.
The consultant provides no services to us other than its advice to the Compensation Committee on executive compensation matters and to our Nominating and Corporate Governance Committee on director compensation matters. The Compensation Committee determined Pay Governance to be independent from the Company under the NYSE and SEC regulations.
Our CEO and CHRO annually reviewsreview the performance of each executive officer. HeThey then recommendsrecommend annual merit salary adjustments and any changes in annual or long-term incentive opportunities or payouts for these officers. The Committee considers the CEO’s Management’s
recommendations in addition to data and recommendations presented by Pay Governance.
The CEO and other members of managementManagement also work with the Committee and its consultant in determining the companies to be included in the Talent Market and Business Segment Comparator Group.Groups.
Impact of Tax and Accounting Treatment
The Compensation Committee selects compensation vehicles based upon those that will, in its view, create the best link between pay and performance. Generally, the accounting and tax treatments of executive
compensation has not been a factor in the Compensation Committee’s decisions regarding the amounts or types of compensation paid.
2016 Annual Meeting and Proxy Statement | 44
Table of Contents
EXECUTIVE COMPENSATION
| 
|
Compensation Tables
The following tables, narrative and footnotes discuss the compensation of the NEOs during 2015.2016.
20152016 Summary Compensation Table
Name and Principal
Position (1) (1) | Year | Salary
($) | Bonus
($) | Stock Awards
($) | Option
Awards
($) | Non-Equity
Incentive Plan
Compensation
($) | Change in
Pension Value
and
Nonqualified
Deferred
Compensation
Earnings (2)
($) | All Other Compensation
($) | Total
($) |
Eric M. Green (3)
President and Chief Executive Officer | 2015 | 473,846 | 616,667 | 3,174,950 | 3,175,106 | 614,259 | 42,927 | 267,697 | 8,365,452 |
William J. Federici
Sr. V.P. and Chief Financial Officer | 2015
2014
2013 | 515,483
467,023
457,866 | —
| 350,015
349,985
349,966 | 350,006
349,998
350,005 | 447,210
281,967
419,759 | 119,960
241,242
90,474 | 24,388
39,949
39,635 | 1,807,062 1,730,164 1,707,705 |
Karen A. Flynn
Sr. V.P. and Chief Commercial Officer | 2015
2014 | 425,526
345,954 | —
| 312,512
310,043 | 326,744
300,002 | 359,630
214,757 | 19,334
93,798 | 33,191
33,848 | 1,476,937 1,298,402 |
John E. Paproski
Sr. V.P. and Chief Technology Officer | 2015
2014
2013 | 374,196
350,339
339,926 | —
| 299,990
299,994
299,999 | 299,994
300,004
300,005 | 272,580
234,191
286,322 | 112,865
336,873
55,201 | 30,706
93,137
45,710 | 1,390,331 1,614,538 1,327,163 |
George L. Miller (3)
Sr. V.P., General Counsel and Corporate Secretary | 2015 | 41,538 | 66,667 | 700,065 | 299,988 | — | 2,769 | 13,403 | 1,124,430 |
Donald E. Morel, Jr. (3)
Former Chairman and Chief Executive Officer | 2015
2014
2013 | 461,857
837,721
825,028 | —
| 1,199,991
1,200,022
1,199,992 | 1,200,030
1,199,996
1,200,005 | 537,413
723,880
1,072,371 | 965,793
832,608
93,375 | 242,107
95,756
122,645 | 4,607,191 4,889,983 4,513,416 |
Name and Principal
Position | | Year | | Salary
($) | | Bonus
($) | | Stock Awards
($) | | Option
Awards
($) | | Non-Equity
Incentive Plan
Compensation
($) | | Change in
Pension Value
and
Nonqualified
Deferred
Compensation
Earnings (1)
($) | | All Other
Compensation
($) | | Total
($) | |
Eric M. Green (2)
President & Chief Executive Officer | | 2016 | | 749,039 | | — | | 1,026,285 | | 1,000,020 | | 738,575 | | 70,066 | | 64,142 | | 3,648,127 | |
| 2015 | | 473,846 | | 616,667 | | 3,174,950 | | 3,175,106 | | 614,259 | | 42,927 | | 267,697 | | 8,365,452 | |
| | | | | | | | | | | | | | | | | | | |
William J. Federici
Sr. V.P, Chief Financial Officer & Treasurer | | 2016 | | 517,264 | | — | | 350,027 | | 350,005 | | 375,244 | | 249,457 | | 21,616 | | 1,863,613 | |
| 2015 | | 515,483 | | — | | 350,015 | | 350,006 | | 447,210 | | 119,960 | | 24,388 | | 1,807,062 | |
| 2014 | | 467,023 | | — | | 349,985 | | 349,998 | | 281,967 | | 241,242 | | 39,949 | | 1,730,164 | |
| | | | | | | | | | | | | | | | | | | |
Karen A. Flynn
Sr. V.P. & Chief Commercial Officer | | 2016 | | 439,881 | | — | | 350,027 | | 350,005 | | 309,960 | | 91,642 | | 27,162 | | 1,568,677 | |
| 2015 | | 425,526 | | — | | 312,512 | | 326,744 | | 359,630 | | 19,334 | | 33,191 | | 1,476,937 | |
| 2014 | | 345,954 | | — | | 310,043 | | 300,002 | | 214,757 | | 93,798 | | 33,848 | | 1,298,402 | |
| | | | | | | | | | | | | | | | | | | |
George L. Miller (2)
Sr. V.P., General Counsel & Corporate Secretary | | 2016 | | 400,000 | | — | | 299,989 | | 300,011 | | 247,780 | | 27,468 | | 239,945 | | 1,515,193 | |
| 2015 | | 41,538 | | 66,667 | | 700,065 | | 299,988 | | — | | 2,769 | | 13,403 | | 1,124,430 | |
| | | | | | | | | | | | | | | | | | | |
Annette F. Favorite
Sr. V.P. & CHRO | | 2016 | | 300,000 | | 150,000 | | 158,702 | | 150,028 | | 171,540 | | 28,912 | | 181,709 | | 1,140,891 | |
(1)During 2015, Ms. Flynn was the President, Pharmaceutical Packaging Systems and Mr. Paproski was the President, Pharmaceutical Delivery Systems. As announced on January 12, 2016, West will no longer operate two separate units for its Packaging and Delivery Systems businesses. West established global Commercial, Operations and Innovation & Technology organizations. In connection with these changes, Ms. Flynn and Mr. Paproski were given the principal positions listed in this Summary Compensation Table.
(2) These amounts are an estimate of the increase in actuarial present value of our NEOs’ age-65 accrued benefit under our retirement plans for 2015.2016. Amounts are payable only when a participant’s employment terminates, and may be reduced if benefits are commenced prior to retirement. Assumptions underlying the estimates are described under the 20152016 Pension Benefits Table. Additionally, for Dr. Morel, this amount includes distributions under our retirement plans.
(3)(2) Reflects2015 compensation reflects partial year of compensation based on Mr. Green’s hire and termination dates, as follows: Mr. Green commenced employment ondate of April 24, 2015 and Mr. Miller commenced employment onMiller’s hire date of November 19, 2015 and Dr. Morel terminated employment June 30, 2015.
Bonus
The amounts in the “Bonus” column are comprised of the following:
Name | Relocation Bonus | Retention Cash |
Eric M. Green | $116,667 | $500,000 |
George L. Miller | $66,667 | — |
The Relocation Bonus was payable upon relocation to the Exton, Pennsylvania area under our relocation policy for all U.S. salaried employees. The bonus was equal to two months’ salary for Mr. Green and Mr. Miller, and was meant to cover incidental costs. If an employee terminates employment within 12 months of relocation, he or she must repay the relocation bonus. The Retention Cash granted to Mr. Green was payable six months after his start date and was intended to replace his equivalent annual bonus that he forfeited upon leaving his prior employer, Sigma-Aldrich.
2016 Annual Meeting and Proxy Statement | 45
Table of Contents
EXECUTIVE COMPENSATION
| 
|
Stock Awards
Stock Awards Grant Date Fair Value (Target) 2013-20152014-2016
| | | | 2015 | | | | | 2014 | | | | 2013 | | | | 2016 | | 2015 | | 2014 | |
| | PVSU
Awards | | Incentive
Shares | | Restricted
Stock | | PVSU
Awards | | Incentive
Shares | | PVSU
Awards | | Incentive
Shares | | | PSU
Awards | | Incentive
Shares | | PSU
Awards | | Incentive
Shares | | Restricted
Stock | | PSU
Awards | | Incentive
Shares | |
Name | | ($) | | ($) | | ($) | | ($) | | ($) | | ($) | | ($) | | | ($) | | ($) | | ($) | | ($) | | ($) | | ($) | | ($) | |
| | | | | | | | | | | | | | | | |
Eric M. Green | | 1,424,918 | | — | | 1,750,032 | | — | | — | | — | | — | | | 999,984 | | 26,301 | | 1,424,918 | | — | | 1,750,032 | | — | | — | |
William J. Federici | | 350,015 | | -0- | | -0- | | 349,985 | | -0- | | 349,966 | | -0- | | | 350,027 | | — | | 350,015 | | — | | — | | 349,985 | | — | |
Karen A. Flynn | | 299,990 | | 12,522 | | -0- | | 300,018 | | 10,025 | | — | | — | | | 350,027 | | — | | 299,990 | | 12,522 | | — | | 300,018 | | 10,025 | |
John E. Paproski | | 299,990 | | -0- | | -0- | | 299,994 | | -0- | | 299,999 | | -0- | | |
George L. Miller | | 300,037 | | — | | 400,028 | | — | | — | | — | | — | | | 299,989 | | — | | 300,037 | | — | | 400,028 | | — | | — | |
Donald E. Morel, Jr. | | 1,199,991 | | — | | -0- | | 1,200,022 | | -0- | | 1,199,992 | | -0- | | |
Annette F. Favorite | | | 149,995 | | 8,707 | | — | | — | | — | | — | | — | |
Mr. Green’s time-vesting restricted stock awardPSU and Incentive share terms and conditions are described in the “Compensation Discussion and Analysis” section of 30,499 shares made on his start date of April 24, 2015 vests 42.9% on the third anniversary of the grant date and the remainder on the fifth anniversary of the grant date. Mr. Miller’s time-vesting restricted stock award of 6,421 shares made on his start date of November 19, 2015, vests 100% on the fourth anniversary of the grant date.
this Proxy Statement. The table below shows the maximum payout for PVSUPSU awards made in 2016, 2015 2014 and 2013.2014.
Stock Awards PVSUPSU Grant Date Maximum Value 2013-20152014-2016
| | 2015 | | 2014 | | 2013 | | | 2016 | | 2015 | | 2014 | |
Name | | ($) | | ($) | | ($) | | | ($) | | ($) | | ($) | |
| | | | | | | | |
Eric M. Green | | 2,849,836 | | — | | — | | | 1,999,968 | | 2,849,836 | | — | |
William J. Federici | | 700,030 | | 699,970 | | 699,932 | | | 700,010 | | 700,030 | | 699,970 | |
Karen A. Flynn | | 599,980 | | 600,036 | | — | | | 700,010 | | 599,980 | | 600,036 | |
John E. Paproski | | 599,980 | | 599,988 | | 599,998 | | |
George L. Miller | | 600,074 | | — | | — | | | 599,978 | | 600,074 | | — | |
Donald E. Morel, Jr. | | 2,399,982 | | 2,400,044 | | 2,399,984 | | |
Annette F. Favorite | | | 299,990 | | — | | — | |
Option Awards
The amounts in the “Option Awards” column reflect the grant date fair value in each year, computed according to FASB ASC Topic 718.
| | The amounts in the “Option Awards” column reflect the grant date fair value in each year, computed according to FASB ASC Topic 718. We use the Black-Scholes option pricing model to calculate grant date fair value based on the following assumptions for the named recipients: |
| | | February 23,
2016 | | November 19,
2015 | | October 20,
2015 | | April 24,
2015 | | February 23,
2015 | | September 29,
2014 | | February 24,
2014 | |
| | November 19,
2015 | | October 20,
2015 | | June 30,
2015 | | April 24,
2015 | | February 23,
2015 | | September 29,
2014 | | February 24,
2014 | | March 26,
2013 | | February 19,
2013 | | | | | | | | | | | | | | | | |
Expected Life (Years) | | 5.8 | | | 5.8 | | | 5.8 | | | 5.8 | | | 5.8 | | | 6.0 | | | 6.0 | | | 6.0 | | | 6.0 | | | | 5.9 | | 5.8 | | 5.8 | | 5.8 | | 5.8 | | 6.0 | | 6.0 | |
Risk-Free Interest Rate | | 1.79% | | | 1.54% | | | 1.79% | | | 1.46% | | | 1.66% | | | 1.77% | | | 1.57% | | | 0.79% | | | 0.89% | | | | 1.35 | % | 1.79 | % | 1.54 | % | 1.46 | % | 1.66 | % | 1.77 | % | 1.57 | % |
Dividend Yield | | 0.88% | | | 0.97% | | | 0.91% | | | 0.92% | | | 0.96% | | | 0.98% | | | 0.85% | | | 1,18% | | | 1.29% | | | | 0.94 | % | 0.88 | % | 0.97 | % | 0.92 | % | 0.96 | % | 0.98 | % | 0.85 | % |
Expected Volatility | | 20.3% | | | 20.1% | | | 20.0% | | | 19.2% | | | 19.1% | | | 21.6% | | | 22.1% | | | 22.3% | | | 22.5% | | | | 20.4 | % | 20.3 | % | 20.1 | % | 19.2 | % | 19.1 | % | 21.6 | % | 22.1 | % |
Black-Scholes Value | | $12.72 | | | $10.70 | | | $11.63 | | | $10.65 | | | $10.19 | | | $9.66 | | | $10.37 | | | $6.20 | | | $5.70 | | | | $ | 11.53 | | $ | 12.72 | | $ | 10.70 | | $ | 10.65 | | $ | 10.19 | | $ | 9.66 | | $ | 10.37 | |
Recipients | | Miller | | | Flynn | | | Morel | | | Green | | | Federici Flynn Paproski | | | Flynn | | | Federici Flynn Paproski Morel | | | Federici Flynn Paproski Morel | | | Federici Flynn Paproski Morel | | | | All | | Miller | | Flynn | | Green | | Federici Flynn | | Flynn | | Federici Flynn | |
|
For a more detailed discussion of the assumptions used to calculate grant date fair value for our options, refer to Note 12 to the consolidated financial statements included in our 20152016 Form 10-K.
Non-Equity Incentive Plan Compensation
The amounts in the “Non-Equity Incentive Plan Compensation” column are AIP awards made with respect to 2016 performance. AIP awards are paid in cash, except participants may elect to 2015 performance. AIP awards are paid in cash, except participants may elect to | | have up to 100% paid in West common stock. With the exception of Mr. Green, all awards were paid in cash. Mr. Green elected to receive
|
2016 Annual MeetingMr. Federici and Ms. Flynn each elected to have their awards paid in cash. Mr. Green elected to receive 25% of his after-tax bonus award in stock. This resulted in a grant of 196 shares of stock, with a grant-date fair value of $17,038 based on a per-share grant price of $86.93. Mr. Green also received a grant of 49 shares of restricted incentive shares, with a grant date fair value of $4,260.
Mr. Miller and Ms. Favorite elected to defer 100% of their total award (net of applicable taxes) to our Employee Deferred Compensation Plan and have it deemed invested in stock with a 25% matching contribution in restricted incentive share stock units. This election resulted in a grant of 2,603 stock units to Mr. Miller and 1,898 stock units to Ms. Favorite on February 14, 2017 with a total grant date fair value of $226,279 and $164,993 respectively. Mr. Miller was also credited with 650 restricted incentive share stock units with a grant date fair value of $56,505, and Ms. Favorite was credited with 474 incentive share stock units with a grant date fair value of $41,205.
The amount of these shares is not included in this column, but will be included in our 2017 Proxy Statement | 46in the “Stock Awards” column, and, if deferred under the Deferred Compensation Plan, will also be reflected in next year’s “Nonqualified Deferred Compensation” Table.
Bonus
Table of ContentsThe amount in this column was a signing and retention award granted to Ms. Favorite upon her hire in October 2015. The amount was paid six months following her start date, which was in April 2016. Ms. Favorite must repay this amount if she terminates employment voluntarily or is terminated for cause before October 1, 2020. The amounts previously reported for Mr. Green and Mr. Miller are discussed in our 2016 Proxy Statement.
EXECUTIVE COMPENSATION
All Other Compensation | 
|
25% of his total after-tax award in stock. This election resulted in a grant of 1,764 shares of stock on February 23, 2016 with a grant date fair value of $105,205, at $59.64 per share. He also received 441 restricted incentive shares with a grant date fair value of $26,301, with the same per-share grant date value.
The amounts in the “All Other Compensation” column consist of: (1) for all NEOs, the total of the Company matching contributions made in 2016 on cash deferrals to the Employee Deferred Compensation Plan and 401(k) plan; (2) Company-paid life insurance premiums; (3) DEUs credited in 2016 on unearned PSUs incurred by Mr. Miller and Ms. Favorite. (assuming a 100% performance level) and unvested time-vesting restricted stock, whether or not those awards have been deferred; (4) reimbursement of relocation expenses for Mr. Miller and Ms. Favorite; and (5) tax reimbursements for taxable moving expenses. All Other Compensation
The amounts in the “All Other Compensation” column consist of: (1) costs of providing a company-leased vehicle, including lease payments, gas, maintenance and insurance; (2) for Mr. Federici, Mr. Paproski, Ms. Flynn, and Dr. Morel, the total of the Company matching contributions made in 2015 on cash deferrals to the Employee Deferred Compensation Plan and 401(k) plan; (3) Company-paid life insurance premiums; (4) DEUs credited in 2015 on unearned PVSUs (assuming a 100%
| | The amount of these shares are not included in this column, but will be included in our 2016 Proxy Statement in the “Stock Awards” column, and, if deferred under the Deferred Compensation Plan, will also be reflected in next year’s “Nonqualified Deferred Compensation” Table.
performance level) and unvested time-vesting restricted stock, whether or not those awards have been deferred; (5) reimbursement of relocation expenses for newly-hired NEOs; (6) the payout of accrued, unused vacation for Dr. Morel; (7) the value of personal retirement benefits provided to Dr. Morel for his service as CEO; and (8) tax reimbursements for taxable moving expenses incurred by Mr. Green and for the in-kind personal retirement benefits provided to Dr. Morel.
|
The table below shows a breakdown of the total amount shown in the “All Other Compensation” column of the Summary Compensation Table.
Components of All Other Compensation – 2015— 2016
Name | | Use of
Company
Car
($) | | Defined
Contribution Plan
Company
Contributions (1)
($) | | Life
Insurance
($) | | Dividends &
Dividend
Equivalents
($) | | Relocation
Expenses (2)
($) | | Tax
Reimburse-
ments (3)
($) | | Vacation
Payout (4)
($) | | Other (5)
($) | | Total
($) | |
Eric M. Green | | — | | -0- | | 312 | | 36,216 | | 138,410 | | 92,759 | | — | | — | | 267,697 | |
William J. Federici | | 574 | | 10,600 | | 509 | | 12,705 | | — | | — | | — | | — | | 24,388 | |
Karen A. Flynn | | 7,040 | | 17,021 | | 365 | | 8,765 | | — | | — | | — | | — | | 33,191 | |
John E. Paproski | | 9,023 | | 10,600 | | 382 | | 10,701 | | — | | — | | — | | — | | 30,706 | |
George L. Miller | | — | | — | | — | | 6,421 | | 6,982 | | — | | — | | — | | 13,403 | |
Donald E. Morel, Jr. | | 2,353 | | 10,600 | | 3,424 | | 40,264 | | — | | 21,807 | | 40,656 | | 123,003 | | 242,107 | |
(1)This amount is comprised of matching contributions to our 401(k) Plan and Employee Deferred Compensation Plan.
(2)The amount in this column is for all expenses reimbursed in connection with Mr. Green’s and Mr. Miller’s relocation to the Exton, Pennsylvania area, exclusive of the tax reimbursements reported in a separate column.
(3)The amount reported in this column for Mr. Green are tax reimbursements for moving expenses that are deemed taxable by the Internal Revenue Code. In accordance with our standard relocation policy applicable to all salaried U.S. employees, the Company grosses up these costs. The amount reported in this column for Dr. Morel are tax reimbursements for the in-kind personal retirement benefits listed in footnote 5, except for the company vehicle.
(4)The amount in this column represents two weeks of accrued, untaken vacation pay, that was payable to Dr. Morel in accordance with our U.S. salaried employees’ vacation policy.
(5)The amount in this column is comprised of in-kind property personal retirement benefits ($25,507), which includes a rare edition book and tour, plus the fair market value of his company vehicle less what he paid the Company for it ($97,496). Dr. Morel paid income taxes of $44,937 on the company vehicle.
Name | | Defined
Contribution Plan
Company
Contributions
($) | | Life
Insurance
($) | | Dividends &
Dividend
Equivalents
($) | | Relocation
Expenses
($) | | Tax
Reimbursements
($) | | Total
($) | |
Eric M. Green | | 29,961 | | 510 | | 33,671 | | — | | — | | 64,142 | |
William J. Federici | | 10,600 | | 510 | | 10,506 | | — | | — | | 21,616 | |
Karen A. Flynn | | 17,595 | | 430 | | 9,137 | | — | | — | | 27,162 | |
George L. Miller | | 14,154 | | 408 | | 7,386 | | 125,984 | | 92,013 | | 239,945 | |
Annette F. Favorite | | 12,000 | | 306 | | 4,561 | | 104,364 | | 60,478 | | 181,709 | |
2016 Annual Meeting and Proxy Statement | 47
Table of Contents
EXECUTIVE COMPENSATION
| 
|
2015 Grants of Plan-Based Awards Table
The following table provides information on stock options and PVSUsPSUs granted to our NEOs in 2015.2016.
| | Estimated Future Payouts Under Non-
Equity
Incentive Plan Awards (1) | Estimated Future Payouts
Under Equity
Incentive Plan Awards (2) | All Other
Stock
Awards:
Number | All Other
Option
Awards:
Number of | Exercise or
Base Price
| Grant
Date
Fair
Value of Stock |
Name | Grant
Date | Threshold
($) | Target
($) | Maximum
($) | Threshold
(#) | Target
(#) | Maximum
(#) | of
Stock or
Units (3)
(#) | Securities
Underlying
Options
(#) | of
Option
Awards
($/Sh) | And
Option
Awards (4)
($) |
| | | | | | | | | | | |
Eric M. Green | 04/24/15 | 241,500 | 483,000 | 724,500 | | | | | | | |
| 04/24/15 | | | | 12,417 | 24,833 | 49,666 | | | | 1,424,918 |
| 04/24/15 | | | | | | | 30,499 | | | 1,750,032 |
| 04/24/15 | | | | | | | | 298,132 | 57.38 | 3,174,105 |
William J. Federici | 02/23/15 | 175,929 | 351,857 | 527,788 | | | | | | | |
| 02/23/15 | | | | 3,492 | 6,983 | 13,966 | | | | 349,988 |
| 02/23/15 | | | | | | | | 36,959 | 50.12 | 350,002 |
Karen A. Flynn | 02/23/15 | 147,269 | 294,538 | 441,806 | | | | | | | |
| 02/23/15 | | | | 2,993 | 5,986 | 11,972 | | | | 300,018 |
| 02/23/15 | | | | | | | | 31,679 | 50.12 | 300,000 |
| 10/30/15 | | | | | | | | 2,500 | 55.42 | 26,570 |
John E. Paproski | 02/23/15 | 127,493 | 254,986 | 382,479 | | | | | | | |
| 02/23/15 | | | | 2,993 | 5,986 | 11,972 | | | | 300,018 |
| 02/23/15 | | | | | | | | 31,679 | 50.12 | 300,000 |
George L. Miller | 11/19/15 | — | — | — | | | | | | | |
| 11/19/15 | | | | 2,408 | 4,816 | 9,632 | | | | 300,037 |
| 11/19/15 | | | | | | | 6,421 | | | 400,028 |
| 11/19/15 | | | | | | | | 23,584 | 60.22 | 599,977 |
Donald E. Morel, Jr. (5) | 02/23/15 | 211,413 | 422,827 | 634,240 | | | | | | | |
| 06/30/15 | | | | 10,331 | 20,661 | 41,322 | | | | 1,199,991 |
| 06/30/15 | | | | | | | | 103,184 | 58.08 | 1,200,030 |
| | | | Estimated Future Payouts Under Non-
Equity Incentive Plan Awards (1) | | Estimated Future Payouts
Under Equity
Incentive Plan Awards (2) | | All Other
Stock
Awards:
Number
of
Stock or | | All Other
Option
Awards:
Number of
Securities
Underlying | | Exercise or
Base Price
of
Option | | Grant
Date
Fair
Value of Stock
and
Option | |
Name | | Grant
Date | | Threshold
($) | | Target
($) | | Maximum
($) | | Threshold
(#) | | Target
(#) | | Maximum
(#) | | Units (3)
(#) | | Options
(#) | | Awards
($/Sh) | | Awards (4)
($) | |
Eric M. Green | | 02/23/16 | | 387,500 | | 775,000 | | 1,162,500 | | | | | | | | | | | | | | | |
| | 02/23/16 | | | | | | | | 8,384 | | 16,767 | | 33,534 | | | | | | | | 999,984 | |
| | 02/23/16 | | | | | | | | | | | | | | 441 | | | | | | 26,301 | |
| | 02/23/16 | | | | | | | | | | | | | | | | 86,732 | | 59.64 | | 1,000,020 | |
William J. Federici | | 02/23/16 | | 196,875 | | 393,750 | | 590,625 | | | | | | | | | | | | | | | |
| | 02/23/16 | | | | | | | | 2,935 | | 5,869 | | 11,738 | | | | | | | | 350,027 | |
| | 02/23/16 | | | | | | | | | | | | | | | | 30,356 | | 59.64 | | 350,005 | |
| | | | Estimated Future Payouts Under Non-
Equity Incentive Plan Awards (1) | | Estimated Future Payouts
Under Equity
Incentive Plan Awards (2) | | All Other
Stock
Awards:
Number
of
Stock or | | All Other
Option
Awards:
Number of
Securities
Underlying | | Exercise or
Base Price
of
Option | | Grant
Date
Fair
Value of Stock
and
Option | |
Name | | Grant
Date | | Threshold
($) | | Target
($) | | Maximum
($) | | Threshold
(#) | | Target
(#) | | Maximum
(#) | | Units (3)
(#) | | Options
(#) | | Awards
($/Sh) | | Awards (4)
($) | |
Karen A. Flynn | | 02/23/16 | | 157,500 | | 315,000 | | 472,500 | | | | | | | | | | | | | | | |
| | 02/23/16 | | | | | | | | 2,935 | | 5,869 | | 11,738 | | | | | | | | 350,027 | |
| | 02/23/16 | | | | | | | | | | | | | | | | 30,356 | | 59.64 | | 350,005 | |
George L. Miller | | 02/23/16 | | 130,000 | | 260,000 | | 390,000 | | | | | | | | | | | | | | | |
| | 02/23/16 | | | | | | | | 2,515 | | 5,030 | | 10,060 | | | | | | | | 299,989 | |
| | 02/23/16 | | | | | | | | | | | | | | | | 26,020 | | 59.64 | | 300,011 | |
Annette F. Favorite | | 02/23/16 | | 90,000 | | 180,000 | | 270,000 | | | | | | | | | | | | | | | |
| | 02/23/16 | | | | | | | | 1,258 | | 2,515 | | 5,030 | | | | | | | | 149,995 | |
| | 02/23/16 | | | | | | | | | | | | | | 146 | | | | | | 8,707 | |
| | 02/23/16 | | | | | | | | | | | | | | | | 13,012 | | 59.64 | | 150,028 | |
(1) These amounts represent the minimum, target and maximum awards under the AIP. The amounts are not reduced to reflect any elections to defer receipt of an executive’s cash bonus or bonus shares under any deferred compensation plan. This column includes prorated targets for Mr. Green based on his start date of April 24, 2015, which resulted in a 69% proration. Mr. Miller was not eligible for an AIP bonus in 2015 given that his hire date was after the November 15 eligibility date.
(2) These amounts represent PVSUsPSUs that may vest depending on attainment of performance targets over a three-year performance period. Mr. Green and Mr. Miller received PVSUs with respect to the 2014-16 performance period at a reduced expected value from the awards for 2015-17 performance period. The amounts in this column are not reduced to reflect any elections to defer receipt of an executive’s PVSUsPSUs under any deferred compensation plan.
(3) The time-vesting restricted stock grants made to Mr. Green vests 57.1% on April 24, 2018 and 42.9% on April 24, 2020. The time-vesting restricted stock grant to Mr. Millerlisted in this column vests 100% on November 19, 2019.after four years or pro rata 25% per year in the event of death, disability or retirement.
(4) This column consists of the fair value of options and stock awards granted during 2015.2016. The per-option grant date fair value (under FASB ASC Topic 718) was $9.47$11.53 for all options and $50.12$59.64 per share for all PVSUsPSUs granted on February 23, 2015. The per-option grant date fair value was $10.65 for all options and $57.38 per share for all PVSUs granted on April 24, 2015. The per-option grant date fair value was 11.63 for all options and $58.08 per share for all PVSUs granted on June 30, 2015. The per-option grant date fair value was $10.70 for all options granted on October 20, 2015. The per-option grant date fair value was $12.72 for all options and $62.30 per share for all PVSUs granted on November 19, 2015.2016. For the assumptions made in determining grant date fair values, refer to Note 12 to the consolidated financial statements included in our 20152016 Form 10-K.
(5)Pursuant to Dr. Morel’s Retirement Separation Agreement, he continues to vest in his PVSUs as if he remained employed and he received a 50% payout of his AIP award for 2015, based on the Company’s 2015 performance.
2016 Annual Meeting and Proxy Statement | 48
Table of Contents
EXECUTIVE COMPENSATION
| 
|
Outstanding Equity Awards Atat Year-End 20152016
The following table contains information on the current holdings of stock options, unearned PVSUsPSUs and restricted stock held by our NEOs on December 31, 2015.2016.
| | | | | | Option Awards (1) | | | | | | Stock Awards | | | |
| | | | | | | | | | | | Restricted Stock(2) | | PVSUs (3)
Equity Incentive Plan Awards | |
Name | | Grant Date | | Number of
Securities
Underlying
Unexercised
Options
Exercisable
(#) | | Number of
Securities Underlying
Unexercised
Options
Unexercisable
(#) | | Option
Exercise
Price
($) | | Option
Expiration
Date | | Number of
Shares or
Units of
Stock That
Have Not Vested
(#) | | Market Value of Shares or Units of Stock That
Have Not
Vested
($) | | Number of
Unearned
Shares, Units or
Other Rights
That Have Not
Vested
(#) | | Market or Payout
Value of Unearned
Shares, Units or
Other Rights That
Have Not Vested
($) | |
Eric M. Green (4) | | | | | | | | | | | | 30,499 | | 1,836,650 | | 49,666 | | 2,990,887 | |
Option Grant 1 | | 4/24/2015 | | | | 164,320 | | 57.38 | | 04/24/2025 | | | | | | | | | |
Option Grant 2 | | 4/24/2015 | | 13,499 | | 40,497 | | 57.38 | | 04/24/2025 | | | | | | | | | |
Option Grant 3 | | 4/24/2015 | | | | 79,816 | | 57.38 | | 04/24/2025 | | | | | | | | | |
William J. Federici | | | | | | | | | | | | -0- | | -0- | | 51,260 | | 3,086,877 | |
| | 2/26/2008 | | 54,996 | | | | 20.85 | | 2/26/2018 | | | | | | | | | |
| | 2/24/2009 | | 52,000 | | | | 16.05 | | 2/24/2019 | | | | | | | | | |
| | 3/22/2010 | | 75,662 | | | | 21.34 | | 3/22/2020 | | | | | | | | | |
| | 2/22/2011 | | 68,494 | | | | 20.43 | | 2/22/2021 | | | | | | | | | |
| | 2/21/2012 | | 61,476 | | 20,492 | | 21.22 | | 2/21/2022 | | | | | | | | | |
| | 2/19/2013 | | 28,536 | | 28,532 | | 29.56 | | 2/19/2023 | | | | | | | | | |
| | 3/26/2013 | | 2,020 | | 2,016 | | 32.19 | | 3/26/2023 | | | | | | | | | |
| | 2/24/2014 | | 8,440 | | 25,311 | | 47.34 | | 2/24/2024 | | | | | | | | | |
| | 2/23/2015 | | | | 34,348 | | 54.14 | | 2/23/2025 | | | | | | | | | |
Karen A. Flynn (5) | | | | | | | | | | | | 725 | | 43,660 | | 34,246 | | 2,062,294 | |
| | 2/21/2012 | | 7,094 | | 2,364 | | 21.22 | | 2/21/2022 | | | | | | | | | |
| | 7/24/2012 | | 23,988 | | 7,994 | | 25.15 | | 7/24/2022 | | | | | | | | | |
| | 2/19/2013 | | 13,170 | | 13,168 | | 29.56 | | 2/19/2023 | | | | | | | | | |
| | 2/24/2014 | | 3,617 | | 10,848 | | 47.34 | | 2/24/2024 | | | | | | | | | |
| | 9/29/2014 | | 3,882 | | 11,646 | | 44.95 | | 9/29/2024 | | | | | | | | | |
| | 2/23/2015 | | | | 29,440 | | 54.14 | | 2/23/2025 | | | | | | | | | |
| | 10/20/2015 | | | | 2,500 | | 55.42 | | 10/20/2025 | | | | | | | | | |
John E. Paproski | | | | | | | | | | | | -0- | | -0- | | 43,780 | | 2,636,432 | |
| | 2/26/2008 | | 18,332 | | | | 20.85 | | 2/26/2018 | | | | | | | | | |
| | 2/24/2009 | | 17,000 | | | | 16.05 | | 2/24/2019 | | | | | | | | | |
| | 3/22/2010 | | 37,832 | | | | 21.34 | | 3/22/2020 | | | | | | | | | |
| | 2/22/2011 | | 34,246 | | | | 20.43 | | 2/22/2021 | | | | | | | | | |
| | 2/21/2012 | | 47,290 | | 15,762 | | 21.22 | | 2/21/2022 | | | | | | | | | |
| | 2/19/2013 | | 21,950 | | 21,948 | | 29.56 | | 2/19/2023 | | | | | | | | | |
| | 3/26/2013 | | 4,036 | | 4,036 | | 32.19 | | 3/26/2023 | | | | | | | | | |
| | 2/24/2014 | | 7,234 | | 21,696 | | 47.34 | | 2/24/2024 | | | | | | | | | |
| | 2/23/2015 | | | | 29,440 | | 54.14 | | 2/23/2025 | | | | | | | | | |
George L. Miller (6) | | | | | | | | | | | | 6,421 | | 386,673 | | 9,632 | | 580,039 | |
Option Grant 1 | | 11/19/2015 | | 1,965 | | 5,895 | | 62.30 | | 11/19/2025 | | | | | | | | | |
Option Grant 2 | | 11/19/2015 | | | | 15,724 | | 62.30 | | 11/19/2025 | | | | | | | | | |
Donald E. Morel, Jr.(7) | | | | | | | | | | | | -0- | | -0- | | 173,224 | | 10,431,549 | |
| | 2/24/2009 | | 200,000 | | | | 16.05 | | 2/24/2019 | | | | | | | | | |
| | 3/22/2010 | | 277,428 | | | | 21.34 | | 3/22/2020 | | | | | | | | | |
| | 2/22/2011 | | 251,142 | | | | 20.43 | | 2/22/2021 | | | | | | | | | |
| | 2/21/2012 | | 189,156 | | 63,050 | | 21.22 | | 2/21/2022 | | | | | | | | | |
| | 2/19/2013 | | 105,356 | | 105,356 | | 29.56 | | 2/19/2023 | | | | | | | | | |
| | 2/24/2014 | | 28,391 | | 86,787 | | 47.34 | | 2/24/2024 | | | | | | | | | |
| | 6/30/2015 | | | | 103,184 | | 58.08 | | 6/30/2025 | | | | | | | | | |
2016 Annual Meeting and Proxy Statement | 49
| | | | Option Awards (1) | | Stock Awards | |
| | | | | | | | | | | | Restricted Stock (2) | | PSUs (3)
Equity Incentive Plan Awards | |
Name | | Grant Date | | Number of
Securities
Underlying
Unexercised
Options
Exercisable
(#) | | Number of
Securities
Underlying
Unexercised
Options
Unexercisable
(#) | | Option
Exercise
Price
($) | | Option
Expiration
Date | | Number of
Shares or
Units of
Stock That
Have Not
Vested
(#) | | Market
Value of
Shares or
Units of
Stock That
Have Not
Vested
($) | | Number of
Unearned
Shares, Units or
Other Rights
That Have Not
Vested
(#) | | Market or Payout
Value of Unearned
Shares, Units or
Other Rights That
Have Not Vested
($) | |
Eric M. Green (4) | | | | | | | | | | | | 30,940 | | 2,624,640 | | 83,200 | | 7,057,856 | |
Hire Grant 1 | | 4/24/2015 | | | | 164,320 | | 57.38 | | 4/24/2025 | | | | | | | | | |
Hire Grant 2 | | 4/24/2015 | | 26,998 | | 26,998 | | 57.38 | | 4/24/2025 | | | | | | | | | |
Hire Grant 3 | | 4/24/2015 | | 19,954 | | 59,862 | | 57.38 | | 4/24/2025 | | | | | | | | | |
| | 2/23/2016 | | | | 86,732 | | 59.64 | | 2/23/2026 | | | | | | | | | |
William J. Federici | | | | | | | | | | | | -0- | | -0- | | 39,454 | | 3,346,883 | |
| | 2/26/2008 | | 54,996 | | | | 20.85 | | 2/26/2018 | | | | | | | | | |
| | 2/24/2009 | | 52,000 | | | | 16.05 | | 2/24/2019 | | | | | | | | | |
| | 3/22/2010 | | 75,662 | | | | 21.34 | | 3/22/2020 | | | | | | | | | |
| | 2/22/2011 | | 68,494 | | | | 20.43 | | 2/22/2021 | | | | | | | | | |
| | 2/21/2012 | | 81,968 | | 20,492 | | 21.22 | | 2/21/2022 | | | | | | | | | |
| | 2/19/2013 | | 42,802 | | 14,266 | | 29.56 | | 2/19/2023 | | | | | | | | | |
| | 3/26/2013 | | 3,028 | | 1,008 | | 32.19 | | 3/26/2023 | | | | | | | | | |
| | 2/24/2014 | | 16,877 | | 16,874 | | 47.34 | | 2/24/2024 | | | | | | | | | |
| | 2/23/2015 | | 8,587 | | 25,761 | | 54.14 | | 2/23/2025 | | | | | | | | | |
| | 2/23/2016 | | | | 30,356 | | 59.64 | | 2/23/2026 | | | | | | | | | |
| | | | Option Awards (1) | | Stock Awards | |
| | | | | | | | | | | | Restricted Stock (2) | | PSUs (3)
Equity Incentive Plan Awards | |
Name | | Grant Date | | Number of
Securities
Underlying
Unexercised
Options
Exercisable
(#) | | Number of
Securities
Underlying
Unexercised
Options
Unexercisable
(#) | | Option
Exercise
Price
($) | | Option
Expiration
Date | | Number of
Shares or
Units of
Stock That
Have Not
Vested
(#) | | Market
Value of
Shares or
Units of
Stock That
Have Not
Vested
($) | | Number of
Unearned
Shares, Units or
Other Rights
That Have Not
Vested
(#) | | Market or Payout
Value of Unearned
Shares, Units or
Other Rights That
Have Not Vested
($) | |
Karen A. Flynn (5) | | | | | | | | | | | | 725 | | 61,502 | | 35,832 | | 3,039,629 | |
| | 2/21/2012 | | 9,458 | | | | 21.22 | | 2/21/2022 | | | | | | | | | |
| | 7/24/2012 | | 31,982 | | | | 25.15 | | 7/24/2022 | | | | | | | | | |
| | 2/19/2013 | | 19,754 | | 13,168 | | 29.56 | | 2/19/2023 | | | | | | | | | |
| | 2/24/2014 | | 7,233 | | 10,848 | | 47.34 | | 2/24/2024 | | | | | | | | | |
| | 9/29/2014 | | 7,764 | | 11,646 | | 44.95 | | 9/29/2024 | | | | | | | | | |
| | 2/23/2015 | | 7,360 | | 29,440 | | 54.14 | | 2/23/2025 | | | | | | | | | |
| | 10/20/2015 | | 625 | | 2,500 | | 55.42 | | 10/20/2025 | | | | | | | | | |
| | 2/23/2016 | | | | 30,356 | | 59.64 | | 2/23/2026 | | | | | | | | | |
George L. Miller (6) | | | | | | | | | | | | 6,421 | | 544,693 | | 19,692 | | 1,670,472 | |
Hire Grant 1 | | 11/19/2015 | | 3,930 | | 3,930 | | 62.30 | | 11/19/2025 | | | | | | | | | |
Hire Grant 2 | | 11/19/2015 | | 3,931 | | 11,793 | | 62.30 | | 11/19/2025 | | | | | | | | | |
| | 2/23/2016 | | | | 26,020 | | 59.64 | | 2/23/2026 | | | | | | | | | |
Annette F. Favorite (7) | | | | | | | | | | | | 4,684 | | 397,344 | | 10,476 | | 888,679 | |
Hire Grant 1 | | 10/5/2015 | | 2,364 | | 2,364 | | 55.09 | | 10/5/2025 | | | | | | | | | |
Hire Grant 2 | | 10/5/2015 | | 2,366 | | 7,098 | | 55.09 | | 10/5/2025 | | | | | | | | | |
| | 2/23/2016 | | | | 13,012 | | 59.64 | | 11/19/2025 | | | | | | | | | |
Table of Contents
EXECUTIVE COMPENSATION
| 
|
(1) All options are exercisable in 25% annual increments beginning one year from the grant date, except as noted in footnote 4 for Mr. Green, and footnote 6 for Mr. Miller, bothand footnote 7 for Ms. Favorite, all of whom were hired during 2015.
(2) Dividends are paid on unvested restricted shares and reinvested as additional stock subject to the same vesting requirements as the underlying shares. The market value of the unvested incentiverestricted shares is based on the closing price of our common stock on December 31, 20152016 of $60.22.$84.83.
(3) Except as noted below for Mr. Green, and Mr. Miller and Ms. Favorite who were hired in 2015, these PVSUsPSUs were awarded on February 19, 2013, February 24, 2014 and February 23, 2015 and each covers a three-year performance period. Although the performance period for the 2013 award ended on December 31, 2015, performance is not actually determined and certified by the Committee until the first quarter of 2016. The 2014 and 2015 awards will be earned (if at all) on December 31, 2016 and December 31, 2017, respectively, subject to the satisfaction of the applicable performance criteria and generally subject to the recipient’s continued employment through those dates. Mr. Green and Mr. Miller received awards that related to the 2014-16 performance period in addition to the 2015-17 performance period. These 2014-16 performance period PVSUsPSUs are at a reduced expectedgrant date fair value compared to the 2015-17 performance period PVSUs,PSUs, but are otherwise subject to the same terms and conditions asthat apply to the awards made to all eligible employees employed at the time of the original grants in February 2014. As required by the SEC’s disclosure rules, because the performance for the most recently completed fiscal year exceeded 100%, the number of PVSUsPSUs shown assumes that a maximum payout of 200% will be achieved for all three awards. Fair market value of the unearned PVSUsPSUs is based on the closing price of our common stock on December 31, 20152016 of $60.22.$84.83. The amounts are not reduced to reflect any elections to defer receipt under any deferred compensation plan.
(4) The options denoted as OptionHire Grant 1 for Mr. Green in the table above and all of the restricted stock granted to Mr. Green will vest 57.1% on April 24, 2018 provided that he remains employed by the Company, terminates with “good reason,” is terminated without “cause” by the Company, dies or becomes disabled. The remaining 42.9% will vest on April 24, 2020, but would be forfeited if employment is terminated for any reason other than death or disability before that date. The options denoted as OptionHire Grant 2 for Mr. Green were 25% vested upon the grant date and the remaining options will vest in 25% increments on February 24, 2016, February 24, 2017 and February 24, 2018. The options denoted as OptionHire Grant 3 for Mr. Green will vest in 25% increments on February 23rd of 2016, 2017, 2018 and 2019. These option vesting schedules are consistent with the schedules for active employees as of February 2014 and 2015, for each respective option. All other grants are subject to the vesting schedules set forth in Notes 1 and 3 above.
(5) The restricted stock are incentive shares granted to Ms. Flynn on February 21, 2012, February 19, 2013, February 18, 2014, and February 23, 2015 and are 100% vested four years from the grant date if the bonus share to which the incentive share relates has not been sold and the employee has not terminated employment. The incentive shares will also vest 25% per year upon retirement. Unvested incentive shares are forfeited on employment termination.
(6) The restricted stock granted to Mr. Miller will vest 100% on November 19, 2019 provided that he remains employed by the Company, terminates with “good reason,” is terminated without “cause” by the Company, dies or becomes disabled. The options denoted as OptionHire Grant 1 for Mr. Miller were 25% vested upon the grant date and the remaining options will vest in 25% increments on February 24,23, 2016, February 24,23, 2017 and February 24,23, 2018. The options denoted as OptionHire Grant 2 for Mr. Miller will vest in 25% increments on February 23rd23 of 2016, 2017, 2018 and 2019. These option vesting schedules are consistent with the schedules for active employees as of February 2014 and 2015, for each respective option. All other grants are subject to the vesting schedules set forth in Notes 1 and 3 above.
(7) PursuantThe restricted stock granted to Dr. Morel’s Retirement Separation Agreement, continued employmentMs. Favorite will vest 100% on October 5, 2019 provided that she remains employed by the Company, terminates with “good reason,” is not a requirementterminated without “cause” by the Company, dies or becomes disabled. The options denoted as Hire Grant 1 for his optionsMs. Favorite were 25% vested upon the grant date and PVSUs to continue vesting. However, the remaining options will only be exercisable atvest in 25% increments on February 23, 2016, February 23, 2017 and February 23, 2018. The options denoted as Hire Grant 2 for Ms. Favorite will vest in 25% increments on February 23 of 2016, 2017, 2018 and 2019. These option vesting schedules are consistent with the same time they would have been exercisable under the original vesting scheduleschedules for active employees as of February 2014 and all PVSUs will only become vested and be paid as applied2015, for each respective option. All other grants are subject to the PVSU grants made to all active employeesvesting schedules set forth in February 2015, even though his awards were not granted until June 30, 2015.Notes 1 and 3 above.
2015 Option Exercises And Stock Vested Table
The following table provides information about the value realized by our NEOs on the exercise of stock options and vesting of stock awards and units during 2015. Mr. Green and Mr. Miller did not exercise2016. No NEO exercised any options or havein 2016. Only Mr. Federici and Ms. Flynn had any stock vest during 2015.2016 as described below.
| | Option Awards | | Stock Awards | | Option Awards | | Stock Awards | |
| | Number of Shares
Acquired on Exercise | | Value Realized on
Exercise (1) | | Number of Shares Acquired
on Vesting (2) | | Value Realized on
Vesting (3) | | | Number of Shares
Acquired on Exercise | | Value Realized on
Exercise (1) | | Number of Shares Acquired
on Vesting (2) | | Value Realized on
Vesting (3) | |
Name | | (#) | | ($) | | (#) | | ($) | | | (#) | | ($) | | (#) | | ($) | |
William J. Federici | | 52,678 | | 1,961,660 | | 26,574 | | 1,369,358 | | | -0- | | -0- | | 13,374 | | 797,625 | |
Karen A. Flynn | | 23,020 | | 954,517 | | 15,331 | | 790,006 | | | -0- | | -0- | | 5,767 | | 343,944 | |
John E. Paproski | | 26,842 | | 1,058,167 | | 20,867 | | 1,076,218 | | |
Donald E. Morel, Jr. | | -0- | | -0- | | 81,768 | | 4,213,505 | | |
(1) The value realized is equal to the difference between the option exercise price and the fair market value of our common stock on the date of exercise, multiplied by the number of options exercised.
(2) This column reflects incentive shares that were awarded in 20112012 and vested in 20152016 and PVSUsPSUs that were awarded in 20122013 and earned in 2015,2016, whether or not either award was deferred under the Employee Deferred Compensation Plan. The total includes additional shares awarded pursuant to DEUs, which are credited on unvested PVSUsPSUs over the three-year vesting period at a rate that assumes the participant will earn the target award. At the time of the payout, the credited DEUs are then increased or decreased based on the payout factor earned for the applicable three-year performance period. Because the payout factor earned for the 2012-2014 performance period was 167.83%, the number of DEUs accrued over that period was multiplied by 167.83%110.60%. Only Mr. PaproskiNo NEO had any incentive shares (424) that vestedvest in 2015, and these shares were deferred under the terms of the Employee Deferred Compensation Plan.2016. The following table shows the PVSUPSU payouts that vested, and the number of additional shares distributed due to DEUs.
2016 Annual Meeting and Proxy Statement | 50
Table of Contents
| EXECUTIVE COMPENSATION
| 
|
Name | | PVSUs Earned | | Dividend
Equivalents Paid on
PVSU Payouts | | | PSUs Earned | | Dividend
Equivalents Paid on
PSU Payouts | |
William J. Federici | | 25,705 | | 869 | | | 12,054 | | 1,320 | |
Karen A. Flynn | | 12,980 | | 361 | | | 5,214 | | 553 | |
John E. Paproski | | 19,744 | | 670 | | |
Donald E. Morel, Jr. | | 79,092 | | 2,676 | | |
(3) The value of the Incentive Shares was determined by multiplying the number of vested shares by $53.75, the fair market value of our common stock on the payout date of February 20, 2015. The value of the PVSUsPSUs was determined by multiplying the number of vested units by $54.14,$59.64, the fair market value of our common stock on the payout date, February 23, 2015.2016.
20152016 Pension Benefits
Retirement Plan
Until December 31, 2006, we maintained a final average pay defined benefit pension plan, which calculated retirement benefits for salaried participants as a percentage of average annual earnings. The normal retirement benefit equals 1.9% of the average of a participant’s five highest consecutive calendar years of compensation out of the participant’s last ten calendar years of service, multiplied by his or her years of service up to 25 years, plus 0.5% of that average multiplied by his or her years of service in excess of 25 but not more than 35 years. The benefit is reduced by the participant’s expected social security benefits.
Effective January 1, 2007, each participant’s accrued benefit under the retirement plan’s pension formula was frozen, and the pension benefits related to service on or after January 1, 2007 for all existing and new participants are expressed as a “cash balance” type formula. Under the cash balance approach, an allocation is made at the end of each calendar year (or on employment termination, if earlier) to a participant’s hypothetical cash balance account. The allocation is determined by the age of the participant and the percentage of annual compensation for that age band pursuant to the basic cash balance formula.
For participants who have attained minimum age and service requirements, an additional annual allocation is made to their accounts to replace all or part of the benefit for participants who were participating in the retirement plan on December 31, 2006 (“transition benefit”). The transition benefit percentage will
remain for the duration of the transition period, which continues until December 31, 2018 or a participant’s
retirement, whichever comes first. The transition benefit is applicable only to employees who were actively employed on January 1, 2007 and the allocation percentage is based on the age of the participant on that date. The transition benefit for Mr. Federici and Mr. Paproski is 8.0%. All other continuing NEOs are not eligible to receive the transition benefit because they were not employed on December 31, 2006. Dr. Morel ceased accruing any benefits in the pension plan upon his retirement on June 30, 2015.
Each year, the balance in the hypothetical account will be credited with interest at a rate equal to the average 30-Year Treasury Bond Rate for November of the year prior to the year the interest is credited.
In general, the compensation used for determining a participant’s benefits under the retirement plan consists of base salary, overtime, annual incentive awards (paid in cash or stock) and other cash remuneration, plus a participant’s contributions to our 401(k) plan.
In December 2016, we announced that we are freezing pay and transition credits to the Retirement Plan as of December 31, 2018. Only interest credits will accrue on previously accrued benefits for eligible participants on January 1, 2019 and beyond. Additionally, we announced that any employees hired on or after January 1, 2017 will not be eligible for the Retirement Plan. In lieu of the Retirement Plan benefits, we have made enhancements to our 401(k) plan, including a non-elective contribution, which will be 3% of a participant’s compensation in 2019.
Normal retirement age under the retirement plan is 65. Participants with ten years of service may retire and commence payment of their frozen benefits upon reaching age 55, with reduced benefits based on their age at the retirement date. A participant may begin distribution of his or her cash balance benefits on employment termination, without regard to age or years of service, but will forego any future interest credits.
The benefit that each participant will receive at retirement will be the sum of the accrued benefit
2016 Annual Meeting and Proxy Statement | 51
under the old pension formula as of December 31, 2006, plus the amount allocated to the participant’s cash-balance account. A participant vests in his or her combined benefit upon completing three years of service.
SERP
IRS requirements limit the compensation that can be used to calculate a participant’s benefit under a qualified retirement plan to $260,000$265,000 and the annual benefit is limited to $210,000. The SERP benefits are substantially equal to the difference between the total benefit accrued under the retirement plan and the amount of benefit the retirement plan is permitted to provide under the statutory limits on benefits and
earnings. The benefits are unfunded and paid out of our general assets. SERP benefits (other than interest credit accruals) will be frozen in a similar manner to the freeze applicable to the Retirement Plan in January 2019.
Before January 1, 2009, SERP benefits were payable at the same time and in the same form as benefits payable under the qualified retirement plan, except that SERP participants could elect to receive their SERP benefits in a lump sum. Due to changes in the tax laws, the SERP was amended effective January 1, 2009 to allow for benefits accrued on or after January 1, 2005 to be payable in a lump sum on the date that is six months following termination of employment. These benefits may be reduced to reflect early commencement of benefits before age 65. Benefits accrued before 2005 are still payable according to the SERP rules in effect on December 31, 2004.
20152016 Pension Benefits Table
The following table shows the present value of accumulated pension benefits that each U.S.-based NEO is eligible to receive under our Retirement Plan and the SERP.
| | Number of Years
Credited Service (1) | Present Value of
Accumulated Benefit (2) | Payments During Last
Fiscal Year | | | | Number of Years
Credited Service (1) | | Present Value of
Accumulated Benefit (2) | | Payments During Last
Fiscal Year | |
Name | Plan Name | (#) | ($) | ($) | | Plan Name | | (#) | | ($) | | ($) | |
Eric M. Green | Retirement Plan | -0- | 11,681 | | — | | | Retirement Plan | | 1 | | 14,012 | | — | |
| SERP | -0- | 31,246 | | — | | | SERP | | 1 | | 56,054 | | — | |
| | | 42,927 | | — | | | | | | | 70,066 | | — | |
William J. Federici | Retirement Plan | 12 | 37,571 | | — | | | Retirement Plan | | 13 | | 74,751 | | — | |
| SERP | 12 | 82,389 | | — | | | SERP | | 13 | | 174,706 | | — | |
| | | 119,960 | | — | | | | | | | 249,457 | | — | |
Karen A. Flynn | Retirement Plan | 30 | -0- | | — | | | Retirement Plan | | 23 | | 55,289 | | — | |
| SERP | 30 | 20,081 | | — | | | SERP | | 23 | | 36,353 | | — | |
| | | 19,334 | (3) | — | | | | | | | 91,642 | | — | |
John E. Paproski | Retirement Plan | 36 | 48,534 | | — | | |
| SERP | 36 | 64,331 | | — | | |
| | 112,865 | | — | | |
George L. Miller | Retirement Plan | -0- | 2,769 | | — | | | Retirement Plan | | 1 | | 18,252 | | — | |
| SERP | -0- | -0- | | — | | | SERP | | 1 | | 9,216 | | — | |
| | | 2,769 | | — | | | | | | | 27,468 | | — | |
Donald E. Morel, Jr. (4) | Retirement Plan | 23 | 170,481 | | 23,325 | | |
Annette F. Favorite | | | Retirement Plan | | 1 | | 15,335 | | — | |
| SERP | 23 | 746,869 | | 25,119 | | | SERP | | 1 | | 13,577 | | — | |
| | | 917,350 | | 48,444 | | | | | | | 28,912 | | — | |
(1) Equals the number of full years of credited service as of December 31, 2015.2016. Credited service begins with a participant’s hire date and ends with the date of employment termination. Mr. Green and Mr. Miller both have received service credit, but have been credited with less than a full year of service.
(2) These present values assume that each NEO retires at age 65 for purposes of the Retirement Plan and the SERP. The assumed cash balance crediting rate is 3.30% in the Retirement Plan and the SERP. The discount rate and pre-retirement mortality assumptions used in estimating the present values of each NEO’s accumulated pension benefit vary by plan, as provided in the table below.
Plan | | Rate | | Pre-retirement Mortality Assumption |
Retirement Plan | | 4.55%4.15%
| | 70% of the present value is calculated using a 50% male and 50% female blended RP-2014 annuitant mortality table without collar adjustment (removing MP-2015 improvement projections from 2007-2015) and applying Scale BB 2-Dimensional mortality improvements from 2006 on a generational basis, 30% of the present value is calculated using the RP-2014 gender specific annuitant mortality tables without collar adjustment (removing MP-2015MP-2014 improvement projections from 2007-2015)2006-2014) and applying Scale BB 2-Dimensional mortality improvements from 2006 on a generational basis. |
2016 Annual Meeting and Proxy Statement | 52
Table of Contents
| EXECUTIVE COMPENSATION
| 
|
Plan |
| Rate |
| Pre-retirement Mortality Assumption |
SERP | | 3.80%3.40%
| | 50% male and 50% female blended RP-2014 annuitant mortality table without collar adjustment (removing MP-2015 improvement projections from 2007-2015) and applying Scale BB 2-Dimensional mortality improvements from 2006 on a generational basis. |
Actual benefit present values will vary from these estimates depending on many factors, including an executive’s actual retirement age, future-credited years of service, future compensation, form of payment election, applicable interest rates and regulatory changes.
(3)Ms. Flynn’s accrual in the Retirement Plan was actually negative. SEC rules prohibit the Company from disclosing a negative amount. However, the total amount listed for Ms. Flynn is net of this reduction.
(4)Dr. Morel commenced his Retirement Plan and SERP benefits as of August 1, 2015. The amount reported in the distribution column represents 5 months’ payments of a $4,665 per month from the Retirement Plan and $5,024 per month from the SERP.
20152016 Nonqualified Deferred Compensation
The Employee Deferred Compensation Plan allows highly compensated employees, including executive officers, to defer up to 100% of salary and cash bonus. Deferred cash contributions may be invested in a selection of investment options that mirror the funds available under our 401(k) plan.
We match at the rate of 100% of the first 3% of salary deferrals, plus 50% of the next 2%. Employer matching contributions made before January 1, 2007 vest 20% per year of service and matching contributions made on or after January 1, 2007 are 100% vested. Participants also may defer payout of annual bonus shares and PVSUs.PSUs. We contribute one time-vested incentive share for each four bonus shares deferred.
Incentive shares will vest on the fourth anniversary of the date of contribution or will vest pro rata on retirement, death and/or disability, if earlier. During the time these
awards are deferred, they are deemed invested in our common stock and receive additional credits
for DEUs. All deferred stock awards are distributed in shares of common stock.
Amounts deferred in any year, except for matching contributions on cash contributions, will be distributed automatically in a lump sum five years after the year of deferral. A participant may choose to defer these amounts to another date or until employment termination. Matching contributions on cash contributions are only distributable on employment termination. Participants may elect to receive their distributions on termination in a cash lump sum, stock lump sum, or in up to ten annual installments.
Mr. Green has not participated in, and Mr. Miller was not yet eligible to participate in, the Employee Deferred Compensation Plan as of December 31, 2015.
20152016 Nonqualified Deferred Compensation Table
Name | | Executive Contributions
in Last FY (1)
($) | | Registrant
Contributions in Last
FY (2)
($) | | Aggregate
Earnings in Last
FY (3)
($) | | Aggregate
Withdrawals/
Distributions
($) | | Aggregate Balance
at Last FYE (4)
($) | | Executive Contributions
in Last FY (1)
($) | | Registrant
Contributions in Last
FY (2)
($) | | Aggregate
Earnings in Last
FY (3)
($) | | Aggregate
Withdrawals/
Distributions
($) | | Aggregate Balance
at Last FYE (4)
($) | |
Eric M. Green | | | 37,452 | | 19,362 | | 3,743 | | -0- | | 60,557 | |
William J. Federici | | -0- | | -0- | | 144,523 | | -0- | | 1,043,812 | | -0- | | -0- | | 426,646 | | -0- | | 1,470,458 | |
Karen A. Flynn | | 74,966 | | 9,770 | | 5,733 | | -0- | | 224,970 | | 21,994 | | 6,995 | | 44,423 | | -0- | | 298,382 | |
John E. Paproski | | -0- | | -0- | | 177,274 | | -0- | | 3,380,427 | |
Donald E. Morel, Jr. | | -0- | | -0- | | 120,521 | | -0- | | 2,359,409 | |
George L. Miller | | | 249,120 | | 3,554 | | 19,637 | | -0- | | 272,311 | |
Annette F. Favorite | | | 150,000 | | 1,400 | | 4,073 | | -0- | | 155,473 | |
(1) The amounts reported in this column are reflected in this year’s Salary column of the Summary Compensation Table. In addition, for Ms. Flynn, the amount includes amounts reported under the Equity Incentive Plan and Non-Equity Incentive Plan columns of the Summary Compensation Table.
(2) The amount in this column represents salary deferral matching contributions.
(3) These amounts reflect the net gains attributable to the investment funds in which the executives have chosen to invest and for deferred shares of stock contributed to the Employee Deferred Compensation Plan.
(4) The total balance includes amounts contributed for prior years which have all been previously reported in the Summary Compensation Table for the year those amounts were deferred.
2016 Annual Meeting and Proxy Statement | 53
Each current U.S. NEO has long-term disability coverage, which is available to all eligible U.S. employees. The coverage provides full salary continuation for six months and thereafter up to 60% of pay with a $25,000 monthly limit. Eligible U.S. employees also continue to earn cash balance pay credits at the rate of pay in effect when they became disabled under the Retirement Plan and SERP. Employees who are vested in our Retirement Plan also receive continued medical coverage while on disability on the same terms as active employees. Deferred
compensation is payable according to the executive’s election. Outstanding unvested stock options granted annually under our long-term incentive plan would be forfeited and outstanding vested stock options would be exercisable for the term of the option. Outstanding PVSUsPSUs and unvested incentive shares would be forfeited when an employee becomes disabled.
The special retention stock and options described forgranted upon hire to Mr. Green, and Mr. Miller aboveand Ms. Favorite will also vest upon disability.
Each current U.S.-based NEO has group life insurance benefits that are available to all eligible U.S. employees. The benefit is equal to one times pay with a maximum limit of $500,000, plus any supplemental life insurance elected and paid for by the NEO. Deferred compensation is payable according to the executive’s election on file. Outstanding
unvested stock options PVSUsgranted annually under our long-term incentive plan, PSUs and incentive
shares would be forfeited and outstanding vested stock options would become exercisable for the term of the option.
The special retention stock and options described forgranted to Mr. Green, and Mr. Miller aboveand Ms. Favorite upon hire will also vest upon death.
Estimated Payments Following Termination
We have agreementsan agreement with Mr. Green and Mr. Paproski that entitle thementitles him to severance benefits on certain types of employment terminations not related to a change-in-control. Dr. Morel also has an agreement that was entered into at the time of his retirement, which is described below. Mr. Federici and Ms. FlynnAll other NEOs are not covered underby an employment agreement or a general severance plan and any severance benefits payable to them under similar circumstances would be determined by the Committee in its sole discretion.
Mr. Green
Mr. Green has an employment agreement that entitles him to continuation of his salary and welfare benefits at active employee rates for a period of 12 months, if he is terminated involuntarily other than for “Cause” or the Company gives notice to Mr. Green that it will not renew the term of his employment under the agreement. Mr. Green’s employment agreement
does not entitle him to severance payments or continued benefits if his employment is terminated for cause or as a resultbecause of his death or disability (except as described above).
The restricted stock and stock options that Mr. Green received as an enticement award (but not any other restricted stock or stock options granted) will vest: (1) in the event of his termination other than for Cause, or (2) due to Good Reason.
“Cause” means any willful failure by Mr. Green to perform his duties or responsibilities or comply with any valid and legal directives of the Board; act of fraud; embezzlement; theft or misappropriation of the funds of the Company by Mr. Green; or Mr. Green’s admission to or conviction of a felony or any crime involving moral turpitude, fraud, embezzlement, theft or misrepresentation; Mr. Green’s engagement in dishonesty, illegal conduct or misconduct that is
2016 Annual Meeting and Proxy Statement | 54
materially injurious to the Company; Mr. Green’s breach of any material obligation of any written agreement with the Company; or a material violation of a rule, policy, regulation or guideline imposed by the Company or a regulatory body.
“Good Reason” means a material diminution in Mr. Green’s base salary; a material reduction in Mr. Green’s duties, authority or responsibilities; or the relocation of Mr. Green’s principal place of employment in a manner that lengthens his one-way commuting distance by fifty (50) or more miles.
Any severance pay would be contingent on execution of a release and other customary provisions, including compliance with non-competition, non-solicitation and confidentiality obligations contained in the agreement.
Mr. Paproski
Mr. Paproski entered into an agreement in 1993 that entitles him to severance payments of his regular salary for 12 months with continued medical benefits during that period at the same rates paid by similarly-situated active employees. These payments are made whether Mr. Paproski
resigns or is involuntarily terminated by the Company provided that he executes a release of claims in favor of the CompanyMiller and adheres to the Company’s confidentiality requirements. Mr. Paproski also may receive outplacement benefits in the event of his termination.
Mr. MillerMs. Favorite
The restricted stock that Mr. Miller and Ms. Favorite received as a retention award will vest: (1) in the event of his termination other than for Cause or (2) due to Good Reason. The definitions of “Cause” and “Good Reason” are the same as those that apply to Mr. Green.
Dr. Morel
Dr. Morel’s retirement occurred on June 30, 2015, and certain payments commenced due to the fact that his retirement was in accordance with an agreement with the Company. These payments to Dr. Morel are described in the Compensation Discussion and Analysis section of this Proxy Statement and the accompanying tables in the Executive Compensation section.
Estimated Additional Severance Payments Table
The table below reflects amounts that eligible executives would receive on termination of employment for certain reasons, other than following a change-in-control. No NEO will receive any enhanced benefit as a resultbecause of a termination for cause. The amounts do not include amounts payable through a plan or arrangement that is generally applicable to all salaried employees, including equity acceleration values to the extent they apply to all LTIP participants.
Name | Event | Cash
Severance | Continuation
of Welfare
Benefits (1) | Vesting of
Unvested Equity | Total | | Event | | Cash
Severance | | Continuation
of Welfare
Benefits (1) | | Vesting of
Unvested Equity | | Total | |
| | | | | | |
Eric M. Green | Involuntary (no Cause) or Good Reason | $700,000 | $18,574 | 2,303,319 | 3,021,893 | | Involuntary (no Cause) or Good Reason | | $ | 775,000 | | $ | 16,554 | | $ | 7,097,814 | | $ | 7,889,368 | |
| Death or Disability | -0- | -0- | 2,303,319 | 2,303,319 | | Death or Disability | | -0- | | -0- | | 7,097,814 | | 7,097,814 | |
John E. Paproski | Involuntary (no Cause), Resignation or Retirement | 353,656 | 18,240 | -0- | 371,896 | |
George L. Miller | Involuntary (no Cause), Good Reason, Death or Disability | -0- | -0- | 386,673 | 386,673 | | Involuntary (no Cause), Good Reason, Death or Disability | | -0- | | -0- | | 544,693 | | 544,693 | |
Annette F. Favorite | | | Involuntary (no Cause), Good Reason, Death or Disability | | -0- | | -0- | | 384,959 | | 384,959 | |
|
(1) This amount reflects the current premium incremental cost to us for continuation of elected benefits to the extent required under an applicable agreement.
2016 Annual Meeting and Proxy Statement | 55
Table of Contents
| EXECUTIVE COMPENSATION
| 
|
Payments on Termination in Connection Withwith a Change-in-Control
We have entered into agreements with each of our U.S.-based NEOs, as well as certain other of our officers, which provide the benefits described below on qualifying terminations of employment in connection with or within two years following a change-in-control.
Mr. Green, Ms. Flynn, and Mr. Miller and Ms. Favorite have Change-in-Control agreements that are substantially similar and include the following:
· Cash severance pay equal to two times the sum of the executive’s highest annual base salary in effect during the year of termination and the average annual bonus for the three years (or, if employed less than three years, the lesser period) immediately preceding the change-in-control.
· Immediate vesting of any unvested benefits and matching contributions under our 401(k) plan and the Employee Deferred Compensation Plan as of the termination of the executive’s employment.
· Immediate vesting of all unvested stock options, stock appreciation rights (“SARs”), shares of stock, stock units and other equity-based awards awarded under any compensation or benefit plan or arrangement.
· Continued medical, dental, life and other benefits for 36 months after termination of the executive’s employment, or until his retirement or eligibility for similar benefits with a new employer.
· Payments will be reduced below the applicable threshold in the Internal Revenue Code if the NEO would be in a better after-tax position than if the excise tax under Section 4999 of the Code applied. Based on assumptions described below, all executives other than Mr. GreenFederici would have his payout reduced in the change-in-control scenario described below. Mr. Miller and Ms. Flynn’s compensation wouldtheir payouts exceed the golden parachute threshold under the Code butCode. No executive other than Ms. Flynn would not have their payments cutback in that scenario because they would be in a better after-tax position by receiving the full amount. Ms. Flynn would be in a better after-tax position by reducing her payments.
· Outplacement assistance.
Severance compensation will also be reduced if an executive reaches normal retirement age or
retires within three years following the change-in-control.
The severance payments are payable in monthly installments and if the executive is a key employee at the time of his termination, payments will be delayed six months to the extent required by applicable tax law.
Employment terminations that entitle these executives to receive the severance benefits under a change-in-control consist of: (1) resignation following a constructive termination of his employment; or (2) employment termination other than by reason ofdue to death, disability, continuous willful misconduct or normal retirement. These terminations must occur within two years after a change-in-control.
To receive the severance benefits under the agreement, an executive must agree not to be employed by any of our competitors or compete with us in any part of the United States for up to one year following employment termination for any reason.
Mr. Paproski’sFederici, under his change-in-control agreement, is substantially the same as those for Mr. Green, Ms. Flynn and Mr. Miller, but his cash severance pay is equal to three times the sum of his annual base salary plus average three-year bonus.
Mr. Federici also is entitled to a payment of three times the sum of his annual base salary plus average three-year bonus. In addition to the benefits described above, his agreement also provides:
· He may trigger his payments under his agreement by resigning during a 30-day period beginning 12 months following the change-in-control.
· He is entitled to full indemnification for any excise taxes that may be imposed by Section 4999 of the Internal Revenue Code in connection with the change-in-control, including interest and penalties, and
2016 Annual Meeting and Proxy Statement | 56
payment of their legal fees and expenses if we contest the validity or enforceability of the agreement. Mr. Federici would not receive a gross-up under the change-in-control scenario described below.
Definitions used in the Change-in-Control Agreements.
Definition of “Change-in-Control.” For each agreement, a “change-in-control” includes any of the following:
· Any person or entity other than us, any of our current directors or officers or a trustee or fiduciary holding our securities, becomes the beneficial owner of more than 50% of the combined voting power of our outstanding securities;
· An acquisition, sale, merger or other transaction that results in a change in ownership of more than 50% of the combined voting power of our stock;
· A change in the majority of our Board of Directors over a two-year period that is not approved by at least two-thirds of the directors then in office who were directors at the beginning of the period; or
· Any event requiring a reporting of a change in control pursuant to the regulations under SEC Form 8-K.8-K; or,
· Execution of an agreement with us, which if consummated, would result in any of the above events.
Definition of “Constructive Termination.” A “constructive termination” generally includes any of the following actions taken by the Company without the executive’s written consent following a change-in-control:
· Significantly reducing or diminishing the nature or scope of the executive’s authority or duties;
· Materially reducing the executive’s annual salary or incentive compensation opportunities;
· Changing the executive’s office location so that he or she must commute more than 50 miles, as compared to his or her commute as of the date of the agreement;
· Failing to provide substantially similar fringe benefits, or substitute benefits that were substantially similar taken as a whole, to the benefits provided as of the date of the agreement; or
· Failing to obtain a satisfactory agreement from any successor to us to assume and agree to perform the obligations under the agreement.
Estimated Benefits on Termination Following a Change-in-Control
The following table shows potential payments to our NEOs if their employment terminates following a change-in-control under existing contracts, agreements, plans or arrangements. The amounts assume a December 31, 20152016 termination date and use the closing price of our common stock as of that date, $60.22.$84.83. Based on current assumptions, Mr. Green’sMs. Flynn’s benefit amounts would be reduced by $1,107,008$334,636 to put himher in a better after-tax position than heshe would have been in had heshe received the full payout and paid the applicable golden parachute excise tax. Because Dr. Morel retired on June 30, 2015, he is no longer entitled to any payments following a change-in-control. All of the values in the table are in U.S. Dollars.
| | | | | | | | | | | | | | | | |
Name | | Aggregate
Severance Pay (1) | | PVSU
Acceleration (2) | | Vesting of
Restricted Stock (3) | | Vesting of Stock
Options (4) | | Parachute
Excise
Tax Impact | | Welfare
Benefits
Continuation (5) | | Outplacement
Assistance (6) | | Total |
| | | | | | | | | | | | | | | | |
| | | | | | | | | | | | | | | | |
Eric M. Green | | 2,800,000 | | 1,847,610 | | 1,836,650 | | 808,538 | | (1,107,008) | | 63,169 | | 25,000 | | 6,273,959 |
| | | | | | | | | | | | | | | | |
| | | | | | | | | | | | | | | | |
William J. Federici | | 2,668,173 | | 843,529 | | -0- | | 2,265,472 | | -0- | | 61,228 | | 25,000 | | 5,584,863 |
| | | | | | | | | | | | | | | | |
| | | | | | | | | | | | | | | | |
John E. Paproski | | 1,806,807 | | 715,293 | | -0- | | 1,859,322 | | — | | 81,840 | | 25,000 | | 4,488,262 |
| | | | | | | | | | | | | | | | |
| | | | | | | | | | | | | | | | |
Karen A. Flynn | | 1,171,596 | | 725,470 | | 43,660 | | 1,284,934 | | -0- | | 58,781 | | 25,000 | | 3,309,441 |
| | | | | | | | | | | | | | | | |
| | | | | | | | | | | | | | | | |
George L. Miller | | 1,320,000 | | 290,020 | | 386,673 | | -0- | | -0- | | 81,947 | | 25,000 | | 2,103,640 |
2016 Annual Meeting and Proxy Statement | 57
Name | | Aggregate
Severance Pay (1) | | PSU
Acceleration (2) | | Vesting of
Restricted Stock (3) | | Vesting of Stock
Options (4) | | Parachute
Excise Tax
Impact | | Welfare
Benefits
Continuation (5) | | Outplacement
Assistance (6) | | Total | |
Eric M. Green | | $ | 3,188,024 | | 2,678,931 | | 2,624,640 | | 9,079,670 | | -0- | | 51,173 | | 25,000 | | 17,647,438 | |
William J. Federici | | 2,723,936 | | 1,046,293 | | -0- | | 3,029,493 | | -0- | | 36,512 | | 25,000 | | 6,861,234 | |
Karen A. Flynn | | 1,441,908 | | 967,910 | | 61,502 | | 1,284,934 | | (334,636 | ) | 46,287 | | 25,000 | | 3,492,905 | |
George L. Miller | | 1,320,000 | | 698,999 | | 544,693 | | 1,009,683 | | -0- | | 50,871 | | 25,000 | | 3,649,246 | |
Annette F. Favorite | | 1,151,580 | | 367,314 | | 397,344 | | 609,172 | | -0- | | 37,360 | | 25,000 | | 2,587,770 | |
| | | | | | | | | | | | | | | | | | |
Table of Contents
| EXECUTIVE COMPENSATION
| 
|
(1) For Mr. Federici and Mr. Paproski, this amount represents three times the sum of the executive officer’s: (a) highest annual base salary in effect during the year of termination; and (b) the average annual bonus for the three years (or, if employed less than three years, the lesser period) (the “Sum Components”). For Mr. Green, Ms. Flynn, and Mr. Miller and Ms. Favorite this amount represents two times the Sum Components. These amounts are based on the salary rates in effect on December 31, 20152016 and AIP bonuses paid during the three years before the year containing the assumed termination date (2012, 2013(2013, 2014 and 2014). Each of Mr. Green and Mr. Miller’s2015) with pro ration applied for executives hired during the year who received an AIP amountspayment. If no AIP payments have been made to the NEO, target bonus amount was presumed to be their target amounts for 2015 — $700,000 and $260,000, respectively.used.
(2) This amount represents the payout of all outstanding PVSUPSU awards on a change-in-control at the target payout.
(3) This amount represents the value of all unvested restricted awards, which would become vested on a change-in-control (whether or not the awards were deferred).
(4) This amount is the intrinsic value, which is equal to the fair market value of a share of stock on December 31, 20152016 minus the per-share exercise price of all unvested stock options for each executive multiplied by the number of unvested options as of December 21, 2015.31, 2016.
(5) This amount represents the employer-paid portion of the premiums for medical, dental and life insurance coverage.coverage for 36 months.
(6) This amount estimates the cost of providing outplacement assistance.
The following tables containtable contains unaudited reconciliations of 20152016 U.S. GAAP consolidated revenues, operating cash flowOCF and diluted EPS to revenues, operating cash flow, operating profitAdjusted Revenue, Adjusted OCF, and adjusted dilutedAdjusted Diluted EPS for annual incentive purposes relating to the 20152016 AIP Performance Metrics and Achievement Table.
20152016 Financial Measures (US$(US$ millions, except per-share data)
Consolidated Performance
|
|
Diluted EPS (1)
| $1.30
|
Foreign-exchange impact relative to rates in effect for budget purposes
| 0.19
|
Retirement Separation Agreement for Dr. Morel
| 0.09
|
Discrete tax items
| 0.01
|
Annuitization of pension liabilities
| 0.43
|
Adjusted Diluted EPS for AIP purposes
| $2.02
|
Operating Cash Flow
| $212.4
|
Foreign-exchange impact relative to rates in effect for budget purposes
| 16.2
|
Additional pension funding credit
| 15.0
|
Adjusted Operating Cash Flow for AIP purposes
| $243.6
|
Consolidated Performance | | | |
Diluted EPS (1) | | $ | 1.91 | |
Foreign-exchange impact relative to rates in effect for budget purposes (“FX”) | | 0.04 | |
Discrete tax items | | 0.01 | |
Restructuring and related charges | | 0.23 | |
Venezuela currency devaluation | | 0.04 | |
Pension curtailment gain | | (0.01 | ) |
| | | |
Adjusted Diluted EPS for AIP purposes | | $ | 2.22 | |
| | | |
Operating Cash Flow | | $ | 219.4 | |
Restructuring and related charges | | 3.0 | |
FX impact | | 0.9 | |
| | | |
Adjusted OCF for AIP purposes | | $ | 223.3 | |
| | | |
Consolidated Revenue | | $ | 1,509.1 | |
FX Impact (2) | | 18.0 | |
| | | |
Adjusted Revenue for AIP purposes | | $ | 1,527.1 | |
Divisional and Regional Performance |
| As
Reported | Foreign-
Exchange
Impact (2) | Adjusted |
Pharma. Packaging Systems Div. Segment Results | | | |
Revenues | 1,000.7 | 73.8 | 1,074.5 |
Operating Profit | 235.7 | 17.5 | 253.2 |
Cash Flow | 285.8 | 18.8 | 304.6 |
Pharma. Delivery Systems Div. Segment Results | | | |
Revenues | 400.2 | 11.6 | 411.8 |
Operating Profit | 12.0 | 1.9 | 13.9 |
(1) A full discussion of components of adjusted dilutedAdjusted Diluted EPS is found in our fourth-quarter and full-year 20152016 earnings press release filed on Form 8-K with the Securities and Exchange Commission on February 18, 2016.16, 2017.
(2) Foreign-exchange impact is based on rates in effect for budget purposes.
INDEPENDENT AUDITORS
2016 Annual Meeting and Proxy Statement | 58
Table of Contents
| INDEPENDENT AUDITORS
| 
|
Independent Auditors And Fees |
Fees Paid to PricewaterhouseCoopers LLP
The following table presents fees for audit and other services provided by PricewaterhouseCoopers LLPPwC for years 20152016 and 2014.2015. All of the services described in the following fee table were approved in conformity with the Audit Committee’s pre-approval process.
Type of Fees | | 2015 | | 2014 | | | 2016 | | 2015 | |
Audit Fees | | $1,869,280 | | | | $1,657,566 | | | $ | 1,935,280 | | $ | 1,869,280 | |
Audit-Related Fees | | 25,510 | | | | 17,500 | | | 1,500 | | 25,510 | |
Tax Fees | | 315,374 | | | | 159,505 | | | 224,014 | | 315,374 | |
All Other Fees | | 5,000 | | | | 11,366 | | | 8,600 | | 5,000 | |
Total | | $2,215,164 | | | | $1,845,937 | | | $ | 2,169,394 | | $ | 2,215,164 | |
Audit Committee Policy on Pre-Approval of Audit and Permissible Non-Audit Services
Our Audit Committee has responsibility for appointing, setting compensation and overseeing the work of the Company’s independent registered public accounting firm. As part of this responsibility, the Audit Committee has established a policy to pre-approve all audit and permissible non-audit services provided by the independent registered public accounting firm. Prior to engagement for the next year’s audit, managementManagement will submit to the Audit Committee a list of services and related fees expected to be rendered by the independent registered public accounting firm during that year for pre-approval by the Committee. Those services must fall within one of the four following categories:
Audit Fees include fees for audit work performed on the financial statements and internal control over financial reporting, and work that generally only the independent registered public accounting firm can reasonably be expected to provide, including statutory audits or financial audits for our subsidiaries or affiliates; services associated with SEC registration statements; periodic reports and other documents filed with the SEC or other
documents issued in connection with securities offerings (e.g., comfort letters, consents); and assistance in responding to SEC comment letters.
Audit-Related Fees are fees for assurance and related services that are reasonably related to the performance of the audit or review of our financial statements and are traditionally performed by the independent registered public accounting firm, including due diligence related to potential business acquisitions/divestitures, financial statement audits of employee benefit plans and special procedures required to meet certain regulatory requirements.
Tax Fees include fees for all services, except those specifically related to the audit of the financial statements, which are performed by the independent registered public accounting firm’s tax personnel and may include tax advice, tax analysis and compliance, and review of income and other tax returns.
All Other Fees are fees for those services not captured in any of the above three categories.
2016 Annual Meeting and Proxy Statement | 59
Table of Contents
| INDEPENDENT AUDITORS
| 
|
Audit Committee Report
The Audit Committee reviewed the Company’s financial-reporting process on behalf of the Board. Management has the primary responsibility for the financial statements and the reporting process, including the system of internal controls. PricewaterhouseCoopers LLP (“PwC”),PwC, the Company’s independent registered public accounting firm for 2015,2016, is responsible for expressing its opinion on the conformity of the Company’s audited financial statements with generally accepted accounting principles and on the effectiveness of the Company’s internal control over financial reporting.
The Audit Committee has reviewed and discussed with managementManagement and PwC the audited financial statements for the year ended December 31, 2015, management’s2016, Management’s assessment of the effectiveness of the Company’s internal control over financial reporting and PwC’s evaluation of the Company’s internal control over financial reporting.
The Audit Committee has discussed with PwC the matters that are required to be discussed by Statement on Auditing Standards No. 61 (Communication With Audit Committees), as amended (AICPA, Professional Standards, Vol. I AU §380), as adopted by the Public Company Accounting Oversight Board in Rule 3200T. PwC has provided to the Committee the written disclosures and the letter required by the applicable requirements of the Public Company Accounting Oversight Board regarding PwC’s communications with the Audit Committee concerning independence and the Committee has discussed with PwC that firm’s independence from the Company.
The Audit Committee also considered whether the independent registered public accounting firm’s provision of non-audit services to the Company is compatible with the auditor’s independence. The Audit Committee has concluded that the independent registered public accounting firm is independent from the Company and its management.Management. Based on the considerations and discussions referred to above, the Audit Committee recommended to the Board that the audited financial statements for the year ended December 31, 20152016 be included in the Company’s 20152016 Form 10-K.
Audit Committee:
Mark A. Buthman, Chairman
Thomas W. Hofmann
Paula A. Johnson
Douglas A. Michels
2016 Annual Meeting and Proxy Statement | 60
Table of Contents
| ITEMS TO BE VOTED ONAudit Committee:
|
| 
|
| Mark A. Buthman, Chairman |
| William F. Feehery |
| Thomas W. Hofmann |
| Paolo Pucci |
ITEMS TO BE VOTED ON
Proposal 1 — Election of Directors
Our shareholders will be asked to consider nineten nominees for election to our Board to serve for a one-year term until the 20172018 Annual Meeting of Shareholders, and until their successors, if any, are elected or appointed, or their earlier death, resignation, retirement, disqualification or removal. The names of the nineten nominees for director, their current positions and offices, tenure as a West director and their qualifications are set forth below.
All of the nominees are current West directors and all non-employee directors have been determined by our Board to be independent. Our Nominating and Corporate Governance Committee reviewed the qualifications of each of the nominees and recommended to our Board that each nominee be submitted to a vote of our shareholders at the Annual Meeting. The Board approved the Committee’s recommendation at its meeting on February 23, 2016.14, 2017.
Each of the nominees has agreed to be named and to serve, and we expect each nominee to be able to serve if elected. If any nominee is unable to serve, the Nominating and Corporate Governance Committee will recommend to our Board a replacement nominee. The Board may then designate the replacement nominee to stand for election. If you voted for the unavailable nominee, your vote will be cast for his or her replacement.
On February 23, 2016, Mr. Welters informed the Board that he will not stand for election at the May 2016 Annual Meeting of Shareholders and will retire from the Board effective as of the date of that meeting. Mr. Welters has served as a Director of the Company since 1997 and has contributed significantly to the success and growth of the Company over the past 19 years. The Board is currently considering whether it will replace Mr. Welters or reduce the size of the Board.
Director Qualifications and Biographies
As a leading manufacturer of pharmaceutical packaging and delivery systems with global operations, we believe that our Board should include a mix of backgrounds and expertise that enhances the ability of the directors collectively to understand the issues facing us and to fulfill the Board’s and its committees’ responsibilities. Board members should have high standards of integrity and commitment, exhibit independence of judgment, be willing to ask hard questions of managementManagement and work well with others.
Directors must devote sufficient time to our affairs and be free of conflicts of interest, engage in constructive discussion with each other and managementManagement and demonstrate diligence and faithfulness in attending Board and committee meetings.
The Nominating and Corporate Governance Committee reviews annually with the Board the size and composition of the Board to determine the qualifications and areas of expertise needed to further enhance the composition of the Board. As a result of this process, thethe Nominating and Corporate Governance Committee has identified the following specific criteria as important for potential director candidates:
· senior-level executive leadership at public companies, particularly companies with international operations;
· leadership in the healthcare or public health fields;
· science or technology backgrounds; and
· financial expertise.
2016 Annual MeetingThe Committee works with Management and Proxy Statement | 61
Tablethe other directors to attract candidates with those and other relevant qualifications. The Committee strives to achieve a Board that reflects an appropriate balance and diversity of Contentsknowledge, experience, skills, expertise, gender and race.
ITEMS TO BE VOTED ON
| 
|
The Committee works with management and the other directors to attract candidates with those and other relevant qualifications. The Committee strives to achieve a Board that
| | reflects an appropriate balance and diversity of knowledge, experience, skills, expertise, gender and race.
|
Our Director Nominees
Mark A. Buthman | |
 
Age: 5556 Director since 2011
Committees: Audit Nominating & Corp. Gov. | Mr. Buthman retired from Kimberly-Clark Corporation in December 2015, where he was Executive Vice President and Chief Financial Officer from January 2003 to April 2015. He joined Kimberly-Clark in 1982 and held positions of increasing responsibility in finance, strategy and operations.operations after joining Kimberly-Clark in 1982. Mr. Buthman is alsoa Board member of IDEX Corporation, Vice Chairman of the Board of Directors of Pavillon, International and a member of the University of Iowa, Tippie College of Business Advisory Board.
Key Skills and Experience: In addition to his financial and accounting experience while Chief Financial Officer at Kimberly-Clark, a global producer of branded products for the consumer, professional and healthcare markets, Mr. Buthman was responsible for real estate, investor relations, information technology, finance and accounting shared services and global procurement for the corporation. Throughout his tenure at Kimberly-Clark, he served in a wide range of leadership roles in the areas of analysis, strategy and mergers and acquisitions. Other public company directorships in the last five years: None |
2015 Annual Meeting and Proxy Statement | 62
Table of Contents
ITEMS TO BE VOTED ON
| 
|
William F. Feehery, Ph.D.

IDEX Corporation |
| |
William F. Feehery, Ph.D. | |

Age: 4546 Director since 2012
Committees: InnovationAudit
Nominating & Technology Corp. Gov. | Dr. Feehery has been President of Industrial Biosciences at E. I. du Pont de Nemours and Company since November 2013. He served as Global Business Director, DuPont Photovoltaic Solutions and previously as Global Business Director, Electronics Growth Businesses and as President of DuPont Displays, Inc. He joinedsince joining DuPont in 2002. Prior to joining DuPont, he was engaged in venture capital and was a management consultant for the Boston Consulting Group.
Key Skills and ExperienceExperience:: Dr. Feehery brings extensive global public company leadership experience to the Board, having served in leadership roles throughout the DuPont organization, a provider of innovative products and services for markets including agriculture, nutrition, electronics, communications, safety and protection, home and construction, transportation and apparel. His experience includes direct responsibility for business operations in over 20 countries and leading a global manufacturing business. In addition, Dr. Feehery brings considerable technical experience with a Ph.D. in chemical engineering and over ten years of experience in the technology industry. Public company directorships in the last five yearsyears:: None |
Eric M. Green | |
 
Age: 4647 Director since 2015
Committees: None | Mr. Green has been our President and Chief Executive Officer since April 2015 and a member of our Board of Directors since May 2015. Prior to joining the Company, Mr. Green worked at Sigma-Aldrich Corporation, where he served as Executive Vice President and President of the company’s Research Markets business unit since 2013.
Key Skills and ExperienceExperience:: Mr. Green has significant public company experience having served as a corporate officer and member of the senior executive team of Sigma-Aldrich prior to joining the Company. Sigma-Aldrich is a leading life science and technology company focused on human health and safety. Mr. Green has had research and development responsibility and managed a $1.4 billion business unit—the largest at that company. Prior to that he held key positions of increasing responsibility, including international sales and operations, corporate strategic planning and positions in the UK, Ireland and Canada. Mr. Green has a chemistry degree and masters of business administration.
Public company directorships in the last five yearsyears:: None |
2015 Annual Meeting and Proxy Statement | 63
Table of Contents
ITEMS TO BE VOTED ON
| 
|
Thomas W. Hofmann |  
Age: 6465 Director since2007
CommitteesCommittees::
Audit Compensation Finance | Mr. Hofmann is the retired from Sunoco, Inc.—an oil refining and marketing company—in 2008, where he was Senior Vice President and CFO of Sunoco, Inc. (oil refining and marketing company), where he served in that capacity from January 2002 untilto December 2008. Mr. Hofmann also served Sunoco in various other senior managementManagement roles since 1990.he joined in 1977.
Key Skills and ExperienceExperience:: Mr. Hofmann provides substantial financial, corporate governance and managementManagement experience with expertise in all areas of finance, finance—including tax, accounting, auditing, treasury, investor relations and budgeting, and hebudgeting. He is well-versed in strategic planning, risk-management and capital-market issues. During a distinguished career with Sunoco, Inc., Mr. Hofmann was involved in a number of unique transactions, including significant acquisitions and divestitures.
Public company directorships in the last five yearsyears:: ·PVR Partners LP (public through September 2014)
·Northern Tier Energy LPGP LLC (through May 2016)
·Columbia Pipeline Partners LP (through February 2017)
|
Paula A. Johnson, M.D., MPH | |
Paula A. Johnson, M.D., MPH
Age: 5657 Director since 2005
Committees:
Audit Innovation & Technology | Dr. Johnson is a cardiologist and has been President of Wellesley College since July 2016. Before joining Wellesley, Dr. Johnson founded and served as the inaugural Executive Director of the Connors Center for Women’s Health and Gender Biology, andas well as Chief of the Division of Women’s Health at Brigham and Women’s Hospital since January 2002.Hospital. A cardiologist, Dr. Johnson also is awas the Grace A. Young Family Professor of Medicine in the Field of Women’s Health—an endowed professorship named in honor of her mother—at Harvard Medical School andSchool. She was also Professor of Epidemiology at the Harvard T.H. Chan School of Public Health. It is expected that Dr. Johnson will be resigning from her current positions and will become President of Wellesley College, Wellesley, Massachusetts, on July 1, 2016.
Key Skills and Experience: Dr. Johnson brings a wealth of leading healthcare expertise to our Board. She is a nationally recognized expert in cardiology and women’s and minority healthcare issues. In her role as Executive Director of the Connors Center for Women’s Health and Gender Biology and as Chief of the Division of Women’s Health at Brigham and Women’s Hospital, and a Professor of Medicine at Harvard Medical School and Professor of Epidemiology at the T.H. Chan Harvard School of Public Health, Dr. Johnson has built a novel, interdisciplinary research, education, clinical and policy program in women’s health whose mission is to improve the health of women and to transform their medical care. Dr. Johnson is the recipient of many awards recognizing her contributions to women’s and minority health and is featured as a national leader in medicine by the National Library of Medicine and is a member of the InstituteNational Academy of Medicine (National Academies).Medicine. She has an extensive background in quality and safety in healthcare and in public health systems.
Public company directorships in the last five yearsyears:: None |
2015 Annual Meeting and Proxy Statement | 64
Table of Contents
ITEMS TO BE VOTED ON
| 
|
Myla P. Lai-Goldman, M.D. |  
Age: 5859 Director since 2014
Committees:
Innovation & Technology Finance | Dr. Lai-Goldman ishas been Chief Executive Officer and President of GeneCentric Diagnostics, Inc. (molecular—a molecular diagnostics company) since June 2011. She is also a director at GeneCentric company—since June 2011 and Qvella Corporation since October 2015. She also serves as director for the company. She is also managing partner of Personalized Science, LLC, a clinical diagnostics consulting company that she founded in 2008. Since August 2011, Dr. Lai-Goldman has been a Venture Partner at Hatteras Venture Partners. From June 2009 to December 2010,Previously, Dr. Lai-Goldman was Chief Executive Officer and Chief Scientific Officer of CancerGuide Diagnostics, Inc. (genomic-based clinicalBefore joining CancerGuide Diagnostics, she held various roles—including Executive Vice President, Chief Medical Officer and pharmaceutical cancer testing and services). Prior to that time, Dr. Lai-Goldman served in various roles Chief Scientific Officer—at Laboratory Corporation of America Holdings and its predecessor company, Roche Biomedical Laboratories (clinical laboratory company), including Executive Vice President, Chief Medical Officer and Chief Scientific Officer.Laboratories. Additionally, Dr. Lai-Goldman has been a venture partner at Hatteras Venture Partners since August 2011.
Key Skills and ExperienceExperience:: Dr. Lai-Goldman is a recognized author and speaker on clinical diagnostics. Public company directorships in the last five yearsyears:: ·Sequenom, Inc.
|
 
Age: 5960 Director since 2011
Committees:
Audit Compensation Innovation and Technology | Mr. Michels serves as President and Chief Executive Officer of OraSure Technologies, Inc. and a member of the OraSure Board of Directors, positions he has held since June 2004. In February 2010, Mr. Michels was appointed to the Presidential Advisory Council on HIV/AIDS. He previously served on the Board of the National Blood Foundation, the Board of the National Committee for Quality Health Care and the Coalition to Protect America’s Health Care.
Key Skills and ExperienceExperience:: Mr. Michels brings considerable expertise and executive leadership skills in the pharmaceutical, medical device and diagnostic industry having spent ten12 years with OraSure Technologies, Inc., 19 years with Johnson & Johnson and seven years with Abbott Laboratories. Public company directorships in the last five years:
OraSure Technologies, Inc. | | | Paolo Pucci | | 
Age: 55 Director since 2016 Committees: Audit Compensation | Mr. Pucci is Chief Executive Officer of ArQule, Inc., a biopharmaceutical company engaged in the research and development of targeted therapeutics. Prior to joining ArQule in 2008, Mr. Pucci worked at Bayer A.G., where he served in a number of leadership capacities including Senior Vice President of the Global Specialty Medicine Business Unit and was a member of the Bayer Pharmaceuticals Global Management Committee.
Key Skills and Experience:
Mr. Pucci provides a wealth of knowledge to our Board regarding biopharmaceutical markets and experience as a chief executive officer of a publicly-traded company. His international background also adds to the diverse knowledge base of our Board. Public company directorships in the last five yearsyears:: · OraSure Technologies,ArQule Inc.
NewLink Genetics Inc. Dyax Inc. (2011-16) |
2015 Annual Meeting and Proxy Statement | 65
Table of Contents
ITEMS TO BE VOTED ON
|
|
 
Age: 6061 Director since 2007
Committees:
Compensation Finance | Mr. Weiland has been President and Chief Operating Officer of C. R. Bard, Inc., —a medical-device company, company—since August 2003, and2003. At Bard, he served as its Group President from April 1997 to August 2003 and its Group Vice President from March 1996 to April 1997. Mr. Weiland also serves as a directorwas elected to the Bard Board of C. R. Bard, Inc. In 2012, Mr. WeilandDirectors in April 2005 and became Vice Chairman of the Board in 2016. He received the prestigious Horatio Alger Award in 2012 and now serves as a director of the Horatio Alger Association.
Key Skills and ExperienceExperience:: Mr. Weiland has considerable expertise with over 30 years of experience in the healthcare industry andindustry. He brings to our Board executive leadership in medical-device company operations withand significant international business expertise.expertise to the Board. As Bard’s President and Chief Operating Officer at C.R. Bard, Inc., Mr. Weiland has responsibility for all of its business operations.
Public company directorships in the last five yearsyears:: ·C. R. Bard, Inc.
|
| Patrick J. Zenner | |  
Age: 6970 Director since 2002 Chairman since 2015
Committees:
Nominating & Corp. Gov. | Mr. Zenner was elected Chairman of the Board effective July 1, 2015. He is retired from Hoffmann-La Roche Inc., North America, America—the prescription drug unit of the Roche Group, a leading research-based healthcare enterprise,enterprise—in 2001, where he served as President and Chief Executive Officer from 1993 to January 2001. He served as Interim Chief Executive Officer of CuraGen Corporation from May 2005 through March 2006. Since then, Mr. Zenner was a director and Chairman of the Board of Exact Sciences Corporation until July 2010, and from July 2007 until March 2008, served as its Interim CEO. He also served as Interim Chief Executive Officer of CuraGen CorporationCEO from May 2005 throughJuly 2007 to March 2006. In addition,2008. Currently, Mr. Zenner serves as Chairman of the Board and a director of ArQule, Inc. He previously served as director of Xoma Corporation from 2002 to 2010 and Par Pharmaceuticals from 2009 to 2012.
Key Skills and ExperienceExperience:: Mr. Zenner provides to the Board overmore than 40 years of experience and expertise in the pharmaceutical industry.industry to the Board. Since retiring from Hoffmann-La Roche, Mr. Zenner has devoted his considerable industry expertise and corporate-governancecorporate governance knowledge to small and early-stage pharmaceutical and technology companies in various capacities, including board member, chairman and interim CEO.
Public company directorships in the last five years:
·ArQule, Inc.·Xoma Coproration
·Par Pharmaceuticals·Exact Sciences Corporation
|
The Board of Directors unanimously recommends a vote FOR the election of
each of these nominees as directors.years:
|
2015 Annual Meeting and Proxy Statement | 66
Table of Contents
ArQule, Inc. | ITEMS TO BE VOTED ON
| 
|
The Board of Directors unanimously recommends a vote FOR the election of each of these nominees as directors. Proposal 2 — Advisory Vote to Approve Named Executive Officer Compensation
At our 20152016 Annual Meeting, our advisory vote on executive pay passed by a vote of 98.7%99.0%. The Board of Directors and its Compensation Committee believed this to be a confirmation that our executive pay accurately and appropriately rewards performance. As described more fully in the “Compensation Discussion and Analysis” section, our executive compensation program is designed to provide competitive executive pay opportunities tied to our short-term and long-term success and attract, motivate and retain the type of executive leadership that will help us achieve our strategic goals. The Compensation Committee continually reviews the compensation programs for our NEOs to ensure they achieve the desired goals of aligning our executive compensation structure with our shareholders’ interests and current market practices. This vote is advisory and not binding on the Company, the Board and the Compensation Committee. However, the Board and the Compensation Committee are interested in the opinions expressed by our shareholders on this proposal and will consider the outcome of the vote when making future compensation decisions for the Named Executive Officers. We encourage shareholders to review the Compensation Discussion and Analysis, beginning on page 25,23, for details regarding our executive compensation program. Accordingly, the following resolution will be submitted for a shareholder vote at the 20162017 Annual Meeting:
“RESOLVED, That the shareholders of West Pharmaceutical Services, Inc. (the “Company”) approve, on an advisory basis, the compensation of the Company’s Named Executive Officers, as disclosed in this proxy statementProxy Statement pursuant to Item 402 of Securities and Exchange Commission Regulation S-K, including the Compensation Discussion and Analysis, compensation tables and narrative disclosures.” The Board of Directors unanimously recommends a vote FOR the approval, on an advisory basis, of the Company’s Named Executive Officer Compensation, as stated in the above resolution. The Board of Directors unanimously recommends a vote FOR the approval, on an advisory basis, of the Company’s Named Executive Officer Compensation, as stated in the above resolution.
|
2016 Annual Meeting and Proxy Statement | 67
Table of Contents
| ITEMS TO BE VOTED ON
| 
|
Proposal 3 — ApprovalAdvisory Vote on the Frequency of the Adoption of the West Pharmaceutical Services, Inc. 2016 Omnibus IncentiveExecutive Compensation PlanVote
To continue providing equity-based and incentive compensation, our Board of Directors has approved and adopted the 2016 Omnibus Incentive Compensation Plan (“2016 Plan”). The 2016 Plan will provide for the award of compensation to both key employees, directors and consultants. The effectiveness of the 2016 Plan is contingent upon shareholder approval as required by NYSE and applicable tax rules. If this proposal is approved, the 2016 Plan will supersede the 2011 Omnibus Incentive Compensation Plan (the “2011 Plan”) and the 2011 Plan will be cancelled. Existing awards under the 2011 Plan will remain outstanding in accordance with their terms, but any amount payable under the 2011 Plan that exceeds the target award will be distributable under the 2016 Plan. If this proposal is not approved, the 2011 Plan will remain in effect.
In determining the number of shares of common stockOur shareholders are permitted by Federal law to be authorized under the 2016 Plan, the Compensation Committee considered the needs of the Company’s long term incentive program and the potential dilution that awarding the
requested shares may haveindicate how frequently we should seek an advisory vote on the existing shareholders. Pay Governance, the Company’s independent compensation consultant, assisted the Companyof our Named Executive Officers (as described in determining the appropriate number of shares to be requested. The consultant examined a number of factors, including the Company’s burn rate andProposal 2). By voting on this Proposal 3, shareholders may indicate whether they would prefer an overhang analysis. The Compensation Committee expects the number of shares available under the 2016 Plan to be sufficient for approximately fouradvisory vote on NEO compensation once every one, two or three years.
The burn ratefrequency of the executive compensation vote is advisory only and is non-binding, however, the Compensation Committee and the Board value the opinions of the shareholders and will consider the outcome of the vote when determining the frequency of the shareholder vote on executive compensation. After careful consideration of this Proposal, our Board has determined that an annual advisory shareholder vote on executive compensation is the total equity awards granted by the Company inmost appropriate for us, and, therefore, our Board recommends that you vote for a fiscal year divided by the weighted average number of shares of common stock outstanding for that fiscal year. Using the publicly disclosed ISS Proxy Advisory Services methodology for calculating burn rate, which applies a multiplier to any full value awards (awards for which the participant does not payone-year interval for the shares), the Company’s three-year average (ISS adjusted) burn rate for equity grants made in fiscal 2013, 2014 and 2015 is less than 2.75%, and below the applicable ISS 2016 burn rate cap.
advisory vote on executive compensation. The Board of Directors unanimously recommends a vote FOR the approval of the adoption of the West Pharmaceutical Services, Inc. 2016 Omnibus Incentive Compensation Plan.
|
2016 Annual MeetingIn making its recommendation, our Board considered that an annual advisory vote on executive compensation will allow our shareholders to provide us with their direct input on our compensation philosophy, policies and Proxy Statement | 68
Table of Contents
| ITEMS TO BE VOTED ON
| 
|
Summary of 2016 Omnibus Incentive Compensation Plan
The following is a summary of the 2016 Plan, which is qualifiedpractices, as disclosed in its entirety by the plan document attached to this Proxy Statement as Appendix A.
Purposeon the most frequent basis. Additionally, an annual advisory vote on executive compensation is consistent with our policy of seeking input from, and engaging in discussions with, our shareholders on corporate governance matters and our executive compensation philosophy, policies and practices.
The purpose of the 2016 Plan is to align the interests of the eligible individuals with the interests of the Company’s shareholders, provide incentives for eligible individuals to exert maximum efforts for the success of the Company and its subsidiaries, and motivate key personnel,You may cast your vote on your preferred voting frequency by means of appropriate incentives, to achieve long-term goals.
Administration
The 2016 Plan is administered by the Compensation Committee of the Board. Our Nominating and Corporate Governance Committee has authority to make recommendations to the Board regarding awards for non-employee directors of the Company. The Compensation Committee cannot make awards to non-employee directors, but will administer those awards as provided below once they have been made by the full Board.
The Compensation Committee has authority to interpret the 2016 Plan and may amend the 2016 Plan as provided below. With respect to participants other than non-employee directors, the Compensation Committee may:
·Select the employees and consultants who are to receive awards under the 2016 Plan;
·Determine the type and amount of awards to be granted to participants and their terms and conditions;
·Determine the times at which awards will be granted; and
·Condition any awards upon the achievement of performance goals or after the lapse of any period of deferral (as described more fully below).
The Compensation Committee may delegate all or a portion of its responsibility to a person selected by it (to the extent permissible by applicable law).
Participation
All consultants, directors and key salaried employees of the Company are eligible to participate in the 2016 Plan. Approximately nine non-employee directors and 100 key salaried employees will be eligible to participate in the 2016 Plan.
Unless otherwise determined by the Committee, certain awards (options, deferred stock, stock units, SARs) are exercisable only by the recipient, and no awards will be transferable other than by will or the laws of descent and distribution. Restricted stock and deferred stock awards are transferable by the recipient once the period of restriction or deferral with respect to such stock lapses. Before the lapse of the restrictions or the deferral period, the stock is not transferable.
Shares of Stock Available for Grant
If shareholder approval is obtained, a total of up to 5,500,000 shares of common stock will be available for issuance under the 2016 Plan. Any stock option or SAR distributable in stock, even if that award is forfeited, will reduce the number of shares available for issuance under the 2016 Plan by one share for each share subject tochoosing the option of one year, two years, three years or stock appreciation right. Any awards under the 2016 Plan that are payable in common stock (other than stock options or stock appreciation rights) will reduce the total number of shares available for grant under the 2016 Plan by an amount equal to 2.5 times the number of shares subject to the award. The shares may be treasury shares or authorized but unissued shares. If any awards made under the previous 2011 Plan before approval of the 2016 Plan would entitle a 2011 Plan participant to an amount of Company stock in excess of the target threshold amount, the additional shares of
2016 Annual Meeting and Proxy Statement | 69
Company stock (up to the maximum threshold amount), shall be distributable under and in accordance with the 2016 Plan. Contingent upon approval of this Proposal No. 3, no additional awards will be granted under the 2011 Plan.
In the event of any stock split, reverse stock split, or stock dividend, any extraordinary cash dividend, recapitalization, reorganization, merger, consolidation, combination, exchange of shares, liquidation, spin-off, split-up or other similar change in corporate structure or capitalization or similar event, then the number and kinds of shares available for awards under the 2016 Plan, the per-participant share limit, the vesting schedule, the exercise price per share subject to each outstanding stock option, and the terms of each other outstanding award shall be adjusted, if necessary to deliver the same amount and tenor of compensation as the original grant, by the Company.
Award Limits
The maximum number of shares subject to options or SARs that may be granted to any one individual other than a non-employee director shall not exceed 500,000 shares during any calendar year, and the maximum payment that can be made to any one individual other than a non-employee director in any one calendar year with respect to deferred stock, restricted stock, stock bonus, stock units and cash-based performance awards will be $7,500,000 as measured on the date of grant. The aggregate grant date fair value (computed as of the date of grant in accordance with applicable financial accounting rules) of awards granted to any non-employee director under the 2016 LTIP during any single calendar year shall not exceed $400,000. However, this limit does not apply to any awards made at the election of a non-employee director to receive awards in lieu of all or a portion of any annual committee cash retainers or other similar cash-based payments.
Service Vesting Requirements
Generally, full-value awards, stock options and stock appreciation rights will vest based on a continued service with the Company over a period of no less than twelve monthsabstain from the date on which such award is granted, except in connection with death, disability, retirement, termination of service without cause or upon a change in control. However, 10% of the
aggregate number of shares authorized for issuance under the 2016 Plan will not be subject to such service vesting requirements.
Change in Control
The Committee may provide in any award agreement or, in the event of a change in control, take such actions as it deems appropriate to accelerate the exercisability and vesting of any unvested award made pursuant to the 2016 Plan in connection with a change in control; awards deferred will be paid prior to or as soon as practicable following a change in control, as determined by the Compensation Committee. The Compensation Committee also may provide that awards are canceled for cash or participants are given an opportunity to exercise outstanding vested options during a window period before a change in control. A “change in control” is defined generally as any such event that requires a report to the SEC, but includes any acquisition or other transaction that results in a change in ownership of more than 50% of the Company’s stock or a change in the majority of the Board over a two-year period that is not approved by at least two-thirds of the directors.
Effective Date and Termination; Amendments
Subject to approval by our shareholders, the 2016 Plan will be effective as of May 3, 2016. The 2016 Plan will terminate on May 3, 2026, unless earlier terminated by the Board. Termination will not affect awards outstanding at the time of plan termination. The Compensation Committee may amend, suspend or terminate the 2016 Plan, provided shareholder approval of any amendment is obtained as required by applicable laws or regulations. The Compensation Committee may amend any outstanding award without a participant’s consent, provided the amendment neither adversely impacts the participant (unless it is necessary to ensure deductibility of the payments under section 162(m) or 280G of the Internal Revenue Code) nor provide for a lower exercise price or base price with respect to options or SARs.
Types of Awards Under the 2016 Plan
Options
Options granted under the 2016 Plan may be either non-qualified stock options or incentive
2016 Annual Meeting and Proxy Statement | 70
stock options qualifying under section 422 of the Internal Revenue Code. The price of any option granted may not be less than closing price of the stock on the date of grant.voting.
The option price is payable in cashof one year, two years or ifthree years that receives the grant allows, shareshighest number of common stock heldvotes cast by shareholders will be the frequency for the advisory vote on executive compensation that has been selected by the option holdershareholders. However, because this vote is advisory only and valued at their fair market value, which may include shares received upon exercise of a portion of a stock option through a cashless net exercise. In addition to the one-year minimum service vesting requirement (see “Service Vesting Requirements”), the Compensation Committee may impose additional restrictionsnot binding on the exerciseBoard or us, the Board may decide that it is in the best interests of any option. The term of a non-qualified stock option may not exceed 10 years. The Company may not, without obtaining shareholder approval: (a) amendour shareholders and us to hold an advisory vote on executive compensation more or modify the terms of any outstanding option or stock appreciation right to reduce the exercise price; (b) cancel, exchange or permit or accept the surrender of any outstanding option or stock appreciation right in exchange for an option or stock appreciation right with a lower exercise price; or (c) cancel, exchange or permit or accept the surrender of any outstanding option or stock appreciation right in exchange for any other award, cash or other securities for purposes of repricing that option or stock appreciation right. Also, no option may be granted to any participant on account of the use of shares to exercise a prior option.
Stock Appreciation Rights
SARs may, but need not, relate to options. The Compensation Committee determines the terms of each SAR at the time of grant. Any freestanding SAR may not be granted for less frequently than the fair market value of the underlying stock at the time of grant and cannot have a term longer than 10 years. Distribution may be made in common stock, in cash or a combination of cash and stock, as determinedoption approved by the Committee.
Deferred Stock
The 2016 Plan provides for the granting of deferred stock. A holder of deferred stock has no voting rights or other rights as a shareholder until shares of common stock are issued and delivered to the participant in settlement of the deferred stock. However, participants holding deferred stock units may receive dividend equivalents
credited in the form of additional deferred stock as determined by the Committee.
Restricted Stock Awards
The 2016 Plan provides for the granting of restricted stock awards. Restricted stock awards may be subject to vesting conditions specified by the Committee based on service subject to the one-year minimum service vesting requirement (see “Service Vesting Requirements”) or performance criteria, including the attainment of one or more performance goals similar to those described below in connection with performance-based awards. Participants may not transfer shares acquired pursuant to a restricted stock award until the shares vest. Unless otherwise provided by the Committee, participants forfeit any unvested shares of restricted stock upon termination of service. Participants holding restricted stock generally may vote the shares and receive any dividends paid; however, the restrictions on the original restricted stock award apply to dividends or distributions paid in shares.
Stock Awards
The 2016 Plan provides for the granting of stock awards and performance awards. It is expected that any executive performance award will be based on consolidated and/or business unit financial performance criteria as described below. The Compensation Committee may also grant restricted stock awards tied to the completion of a specified period of service.
Stock Units
In a stock unit award, the Company will deliver, subject to certain conditions, shares of Common Stock or cash equal to the fair market value of a share of common stock at the end of a vesting or deferral period times the number stock units underlying the stock unit award, which may be determined based on the achievement of one or more performance goals in addition to the one-year minimum service vesting requirement (see “Service Vesting Requirements”). Participants have no voting rights or rights to receive dividends with respect to stock units until shares of common stock are issued in settlement of such awards. However, the Committee may grant stock units that entitle the holders to receive dividend equivalents, which are rights to receive additional stock units or cash amounts on stock
2016 Annual Meeting and Proxy Statement | 71
units that vest based on the value of any cash dividends the Company declares prior to the settlement of vested stock units. Unless otherwise determined by the Committee, settlement of a stock unit will occur upon termination of employment or service. Unvested stock units will be forfeited upon termination of employment.
Cash-Based Performance Awards
The Compensation Committee may grant cash-based performance awards denominated in cash in such amounts and subject to such terms and conditions as the Compensation Committee may determine.our shareholders.
Deferral Election
With the Compensation Committee’s consent, and subject to the requirementsThe Board of section 409A of the Internal Revenue Code, a recipient may defer receipt of unrestricted common stock or a cash payment to a specified date which mayDirectors unanimously recommends that an advisory vote on executive compensation be given by way of approval of a deferred compensation policy for such deferral and administered by in any event.
Performance-Based Awards
To qualify the grants to “covered employees,” as defined in section 162(m) of the Internal Revenue Code, of restricted stock, performance-vesting share units or cash-based performance awards as performance-based compensation that will not be subject to the $1 million limitation on the income tax deductibility of the compensation paid per executive officer which is imposed under section 162(m), the Compensation Committee has authority to structure such grants and awards so that the shares of common stock or cash award will vest only upon the achievement of certain pre-established corporate performance goals based on one or more of the following criteria as applied to the Company, any of its subsidiaries or any other business unit, as determined by the Committee: (1) the price of the common stock; (2) the market share of the Company; (3) sales; (4) earnings per share of common stock; (5) return on shareholder equity; (6) costs; (7) cash flow; (8) total or net assets; (9) return on total or net assets; (10) return on invested capital; (11) liabilities or losses; (12) operating income; (13) net income; (14) revenue; (15) revenue growth; or (16) profit margin. The
performance goals may be based on the performance of the Company or any subsidiary, affiliate or business unit and may be based upon a subset or portion of any of the criteria. Finally, the Performance Goals may be adjusted as determined by the Compensation Committee at the time the performance goals are established.
The Compensation Committee also must designate the length of the performance period during which the performance goals must be achieved and, within the earlier of the first 90 days of a performance period and the lapse of 25% of the period of service to which the performance goals relate, determine which employees will be participants for such period and the kinds and the levels of the performance goals.
Following the completion of a performance period, the Compensation Committee must certify in writing whether, and to what extent, the performance goals for the performance period have been achieved and, if so, shall calculate and certify in writing the amount of the restricted stock or deferred stock vested, or cash-based performance award earned, for the period.
U.S. Federal Tax Treatment of Options and Awards
Incentive Stock Options
In general, neither the grant nor the exercise of an incentive stock option results in taxable income to an option holder or a deduction to the Company. If the option holder holds the stock received upon exercise for at least two years from date of grant and one year after the date of exercise, then the gain realized on disposition of the stock is treated as a long-term capital gain. If the shares are disposed of during this period (a “disqualifying disposition”), then the option holder will include as compensation income for the year of the disposition, in the amount equal to the excess of the fair market value of the shares upon exercise over the option price, or if less, the excess of the amount realized upon disposition over the option price. The Company will be entitled to a corresponding deduction at that time. Any proceeds in excess of the fair market value of the shares on the date of exercise will be treated as short-term or long-term capital gain, depending upon whether the shares have been held for more than one year. If the sales price is less than the exercise price of the option,
2016 Annual Meeting and Proxy Statement | 72
this amount will be treated as a short-term or long-term capital loss, depending on whether the shares have been held for more than one year. The Company will not be entitled to any deduction for amounts the recipient treats as capital gain or loss. Special rules may apply with respect to certain subsequent sales of the shares in a disqualifying disposition, certain basis adjustments for purposes of computing the alternative minimum taxable income on a subsequent sale of the shares and certain tax credits which may arise with respect to option recipients subject to the alternative minimum tax.
Non-Qualified Stock Options
A non-qualified stock option results in no taxable income to the option holder or deduction to the Company at the time it is granted. An option holder will recognize ordinary income at the time a non-qualified stock option is exercised in an amount equal to the excess of the fair market value of the underlying common stock on the exercise date over the exercise price. The Company will generally be entitled to a deduction for federal income tax purposes in the same amount as the amount included in ordinary income by the option holder. Gain or loss on a subsequent sale or other disposition of the shares acquired upon the exercise of a non-qualified stock option will be measured by the difference between the amount realized on the disposition and the tax basis of such shares, and will generally be long-term capital gain depending on the holding period involved. The tax basis of the shares acquired upon the exercise of any non-qualified stock option will be equal to the sum of its exercise price and the amount included in income with respect to such option.
Stock Appreciation Rights (SAR)
A recipient realizes no taxable income when a SAR is granted. Upon exercising a SAR, a recipient will realize ordinary income in an amount equal to the cash received. Generally, there will be no federal income tax deduction allowed to the Company upon the grant or termination of SARs. However, upon exercise of a SAR, the Company will be entitled to a deduction equal to the amount of ordinary income the recipient is required to recognize as a result of the exercise.
Restricted Stock; Performance Shares
Generally, no income will be recognized at the time of grant of a stock award or performance award if such award is subject to a substantial risk of forfeiture. The recipient will realize ordinary income equal to the fair market value of the shares at the time the restrictions lapse. A recipient’s tax basis in shares of restricted stock will be equal to their fair market value when the forfeiture restrictions lapse, and the recipient’s holding period for the shares will begin at that time. Upon sale of the shares, the recipient will realize short-term or long-term gain or loss, depending upon whether the shares have been held for more than one year at the time of sale. Such gain or loss will be equal to the difference between the amount realized upon the sale of the shares and the tax basis of the shares in the recipient’s hands.
Stock Bonuses
Stock Bonuses are shares of stock issued on an after-tax basis in lieu of a cash bonus without restrictions. The fair market value of the stock is immediately includible in income, and we are entitled to an immediate deduction for the same amount. The recipient’s basis in the stock is equal to the fair market value, and the recipient will have a capital gain or loss depending on increases or decreases in the stock price.
Deferred Stock
Deferred Stock awards are unsecured, unfunded promises to distribute stock at a designated time. Deferred Stock will not be taxable until the stock is actually distributed to the recipients. When the deferral period for the award ends and the recipient receives shares of common stock, the recipient will realize ordinary income equal to the fair market value of the shares at that time, as applicable. A recipient’s tax basis in shares of common stock received at the end of a deferral period will be equal to the fair market value of such shares when received. Upon sale of the shares, the recipient will realize short-term or long-term capital gain or loss, depending upon whether the shares have been held for more than one year at the time of sale. Such gain or loss will be equal to the difference between the amount realized upon the sale of the shares and the tax basis of the shares in the recipient’s hands.
2016 Annual Meeting and Proxy Statement | 73
Stock Units
Stock units are similar to deferred stock, but are payable in shares of common stock or cash. A recipient realizes no taxable income when a stock unit award is made. Upon the settlement of such an award, recipients normally will recognize ordinary income in the year of receipt in an amount equal to the cash received or the fair market value of any substantially vested shares received. If the recipient is an employee, such ordinary income generally is subject to withholding of income and employment taxes.
Cash-Based Performance Awards
A recipient realizes no taxable income when a cash-based performance award is made. When such award is paid to the recipient, then the participant will realize ordinary income in an amount equal to the payment and such payment will be deductible by the Company, subject to the limitations in section 162(m) of the Internal Revenue Code for “covered employees.”
Potential Limitation on Company Deductions.
In accordance with applicable regulations issued under Section 162(m) of the Internal Revenue Code, compensation attributable to stock options and SARs should qualify as performance-based compensation, provided that: (1) the 2016 Plan contains a per-employee limitation on the number of shares for which options or SARs may be granted during a specified period; (2) the per-employee limitation is approved by the
stockholders; (3) the option or SAR is granted by a compensation committee comprised solely of outside directors (as defined in Section 162(m)); and (4) the exercise price of the option or SAR is not less than the fair market value of the stock on the date of grant. The 2016 Plan provides for an annual per employee limitation as required under Section 162(m), and our Compensation Committee is comprised solely of outside directors. Accordingly, options or stock SARs granted by the Compensation Committee should qualify as performance-based compensation. Other performance based awards may also qualify.basis.
Deferral Elections
Generally, awards deferred by recipients under any applicable non-qualified deferred compensation plan are not taxable until the awards are paid to the recipient. At that time, the amounts will be includible in income and the Company will be entitled to a deduction.
New Plan Benefits
The benefits that will be awarded or paid under the 2016 Plan are not currently determinable. Awards granted under the 2016 Plan to employees and consultants are within the discretion of the Compensation Committee and awards granted to non-employee directors are within the discretion of the Nominating and Corporate Governance Committee. Neither committee has determined future award amounts or recipients.
EQUITY COMPENSATION PLAN INFORMATION
As required by applicable SEC rules, the following table sets forth information about the grants of stock options, restricted stock or other rights under all of the Company’s equity compensation plans as of the close of business on December 31, 2015. The table does not include information about tax-qualified plans such as the West 401(k) Plan or the Tech Group Puerto Rico, Inc. Savings and Retirement Plan.
2016 Annual Meeting and Proxy Statement | 74
Table of Contents
| ITEMS TO BE VOTED ON
| 
|
Plan Category | | Number of Securities
to be Issued Upon
Exercise of
Outstanding Options,
Warrants and Rights (a) | | Weighted-Average
Exercise Price of
Outstanding
Options,
Warrants and Rights
(b) | | Number of Securities
Remaining Available for
Future Issuance Under
Equity Compensation
Plans (Excluding Securities
Reflected in Column (a)) (c) | | Equity compensation plans approved by security holders | | 5,964,740 | (1) | $ | 31.62 | (2) | 6,541,710 | (3) | | | | | | | | | | Equity compensation plans not approved by security holders | | — | | — | | — | | | | | | | | | | Total | | 5,964,740 | | $ | 31.62 | | 6,541,710 | | | | | | | | | | |
(1)Includes 3,152,653 outstanding stock options, 131,924 outstanding stock-settled stock appreciation rights, 416,418 restricted performance share units, 41,458 restricted retention share units, 259,417 deferred stock-equivalents units and 428 restricted stock-equivalent units granted to directors under the 2011 Plan. Includes 1,745,308 outstanding stock options and 90,988 deferred stock-equivalents units granted to directors under the Non-Qualified Deferred Compensation Plan for Non-Employee Directors under the 2007 Omnibus Incentive Compensation Plan (which was terminated in 2011). Includes 126,146 outstanding stock options under the 2004 Stock-Based Compensation Plan (which was terminated in 2007). The average term of remaining options and stock-settled stock appreciation rights granted is 6.3 years. No future grants or awards may be made under the terminated plans. The total includes restricted performance share units at 100% of grant. The restricted performance share unit payouts were at 167.8%, 124.4%, and 113.4% in 2015, 2014 and 2013, respectively. The total does not include stock-equivalent units granted or credited to directors under the Non-Qualified Deferred Compensation Plan for Non-Employee Directors to be settled only in cash.
(2)Restricted performance share and deferred stock-equivalent units are excluded when determining the weighted-average exercise price of outstanding options and stock-settled stock appreciation rights.
(3)Represents 4,053,829 shares reserved under the Company’s Employee Stock Purchase Plan and 2,487,881 shares remaining available for issuance under the 2011 Plan. The estimated number of shares that could be issued for 2015 from the Employee Stock Purchase Plan is 679,400. This number of shares is calculated by multiplying the 430 share per offering period per participant limit by 1,580, the number of current participants in the plan. Any remaining shares available under the 2011 Plan will be cancelled upon approval of Proposal No. 3.
2016 Annual Meeting and Proxy Statement | 75
Table of Contents
| ITEMS TO BE VOTED ON
| 
|
Proposal 4 — Ratification of the Appointment of PricewaterhouseCoopers LLP as ourOur Independent Registered Public Accounting Firm for the 20162017 Year
The Audit Committee has appointed PwC as our independent registered public accounting firm for 2016. 2017. Although shareholder approval for this appointment is not required, the Audit Committee and our Board are submitting the selection of PwC for ratification to obtain the views of shareholders and as a matter of good corporate governance. If the appointment is not ratified, the Audit Committee will reconsider whether or not to retain PwC. Representatives of PwC will be present at the 20162017 Annual Meeting to answer questions and will have the opportunity to make a statement if they desire to do so.
The Board of Directors unanimously recommends a vote FOR the ratification of the appointment of PricewaterhouseCoopers LLP as our independent registered public accounting firm for 2016 year.
|
2016 Annual Meeting and Proxy Statement | 76The Board of Directors unanimously recommends a vote FOR the ratification of the appointment of PricewaterhouseCoopers LLP as our independent registered public accounting firm
for the 2017 year. OTHER INFORMATION
Table of Contents
| OTHER INFORMATION
|
|
Stock Ownership Based on a review of filings with the Securities and Exchange Commission, we have determined that the persons listed below hold more than 5% of the outstanding shares of our common stock as of March 8, 2016.7, 2017. Unless otherwise stated, each holder has sole voting and dispositive power over the shares listed. Name and Address of Beneficial Owner | | Shares | | Percent of Class | | Shares | | Percent of Class | | T. Rowe Price Associates, Inc.
100 East Pratt Street
Baltimore, MD 21202 | | 8,581,170 (1) | | 11.80 | | 9,808,189 | (1) | 13.4 | % | The Vanguard Group, Inc.
100 Vanguard Boulevard
Malvern, PA 19355 | | | 6,048,328 | (2) | 8.2 | % | BlackRock, Inc.
55 East 52nd Street
New York, NY 10022 | | 6,164,987 | | 8.48 | | 5,418,519 | | 7.4 | % | The Vanguard Group, Inc.
100 Vanguard Boulevard
Malvern, PA 19355 | | 5,321,348 (2) | | 7.32 | | Neuberger Berman Group LLC
605 Third Avenue
New York, NY 10158 | | 4,796,500 (3) | | 6.60 | | 3,990,299 | (3) | 5.4 | % | Franklin Advisory Services, LLC
One Parker Plaza, Ninth Floor
Fort Lee, NJ 07024 | | 4,025,879 | | 5.54 | | 3,949,044 | | 5.4 | % |
(1) Includes sole voting power over 2,168,4582,303,862 shares and sole dispositive power over 8,581,1709,808,189 shares. (2) Includes sole voting power over 158,36442,120 shares, shared dispositive power over 158,06447,042 shares and sole dispositive power over 5,163,2846,001,286 shares. (3) Includes shared dispositive power with respect to 4,796,5003,990,299 shares and shared voting power with respect to 4,787,740.3,978,825. The following table shows the number of shares of our common stock beneficially owned as of March 8, 2016,7, 2017, by each of our directors, each NEO and all current directors and executive officers as a group. For executive officers, in addition to shares owned directly, the number of shares includes: (a) vested shares held in employee participant accounts under our 401(k) plan, Employee Deferred Compensation Plan and Employee Stock Purchase Plan; and, (b) time-vested restricted stock held in various incentive plan accounts, unless receipt of those shares has been deferred. For non-employee directors, in addition to shares owned directly, the common stock column includes vested deferred stock and stock-settled stock units awarded under the Director Deferred Compensation Plan. Name | Common Stock | Options Exercisable
Within 60 Days | Percent of
Class | | Common Stock | | Options Exercisable Within 60 Days | | Percent of
Class | | Mark A. Buthman | 19,579 | -0- | * | | 21,987 | | — | | * | | Annette F. Favorite | | | 8,095 | | 11,531 | | * | | William J. Federici | 229,678 | 404,414 | * | | 229,406 | | 444,301 | | * | | William F. Feehery | 14,699 | -0- | * | | 17,072 | | — | | * | | Karen A. Flynn | 29,299 | 71,675 | * | | 19,030 | | 109,325 | | * | | Eric M. Green | 51,184 | 46,952 | * | | 59,755 | | 102,088 | | * | | Thomas W. Hofmann | 34,637 | -0- | * | | 34,676 | | — | | * | | Paula A. Johnson | 39,093 | -0- | * | | 36,101 | | — | | * | | Myla P. Lai-Goldman | 5,512 | -0- | * | | 7,820 | | — | | * | | Douglas A. Michels | 19,579 | -0- | * | | 21,987 | | — | | * | | George L. Miller | 8,243 | 7,861 | * | | 12,513 | | 20,262 | | * | | Donald E. Morel, Jr. | 804,618 | 1,196,670 | 2.75 | | John E. Paproski | 104,153 | 231,266 | * | | Paolo Pucci | | | 1,279 | | — | | * | | John H. Weiland | 39,105 | -0- | * | | 41,651 | | — | | * | | Anthony Welters | 43,758 | -0- | * | | Patrick J. Zenner | 48,322 | -0- | * | | 63,611 | | — | | * | | All directors and executive officers as a group (21 persons) | 1,617,384 | 2,112,520 | 5.13 | | All directors and executive officers as a group (17 persons) | | | 616,515 | | 780,707 | | 1.9 | % |
* Less than one percent of outstanding shares. 2016 Annual Meeting and Proxy Statement | 77
Table of Contents
| OTHER INFORMATION
| 
|
Section 16(a) Beneficial Ownership Reporting Compliance
During the last fiscal year, due to administrative processing and delays with the Company, the following directors filed late Form 4s – Mr. Welters, Mr. Weiland,—Mr. Buthman, Dr. Lai-Goldman, Mr. Michels Ms. Lai-Goldman and Mr. Buthman (all should have been filed on December 31, 2015). Additionally, due to administrative processing and delays, the followingWeiland. No officers filed late Form 4s with transactions as of the dates listed after eachduring 2016. officer’s name: Michael A. Anderson (February 19 and June 2, 2015); Warwick Bedwell (February 19, 2015); Mr. Federici (February 17, 2015); Ms. Flynn (February 19, 2015); Heino Lennartz (February 19 and February 26, 2015); Richard D. Luzzi (February 19, 2015); Mr. Paproski (February 23, 2015); and Christopher G. Ryan (February 17, 2015).
20152016 Annual Report and SEC Filings
Our financial statements for the year ended December 31, 20152016 are included in our Annual Report on Form 10-K, which we will make available to shareholders at the same time as this Proxy Statement. Our Annual Report and this Proxy Statement are posted on our website at http://www.westpharma.com/na/en
/Investors/Pages/ProxyMaterials.aspxinvestor.westpharma.com/phoenix.zhtml?c=118197&p=irol-reportsannual and are available from the SEC at its website at www.sec.gov. If you do not have access to the Internet or have not received a copy of our Annual Report, you may request a copy of it or any exhibits thereto without charge by writing to our Corporate Secretary at West Pharmaceutical Services, Inc., 530 Herman O. West Drive, Exton, PA 19341.
20172018 Shareholder Proposals or Nominations
Under SEC rules, if a shareholder wants us to include a proposal in our Proxy Statement and form of proxy for presentation at the 20172018 Annual Meeting, the proposal must be received by us at our principal executive offices by November 23, 201622, 2017 and comply with the procedures of Rule 14a-8 under the Securities Exchange Act of 1934. The proposal should be sent to the attention of the Corporate Secretary in writing: West Pharmaceutical Services, Inc., 530 Herman O. West Drive, Exton, PA 19341; or by telephone: (610) 594-3319. Our Bylaws contain procedures that a shareholder must follow to nominate persons for election as directors or to introduce an item of business at an annual meeting of shareholders. Nominations for director nominees or an item of business to be conducted must be submitted in writing to the Corporate Secretary of the Company at our executive offices and should be mailed by certified mail, return receipt requested. We must receive the notice of your intention to introduce a nomination or to propose an item of business at our 20172018 Annual Meeting not less than 90 days prior to the anniversary date of this year’s Annual Meeting. If, however, we fail to disclose the date of next year’s meeting at least 21 days in advance, we must receive your notice within seven days following the announcement of the meeting (but in no event, later than four days before the meeting date). The nomination must contain information about the nominees as specified in our Bylaws. The notice must include information specified in our Bylaws, including information concerning the nominee or proposal, as the case may be, and information about the shareholder’s ownership of and agreements related to our shares. Except as otherwise required by law, the Chairman of the meeting may refuse to allow the transaction of any business, or to acknowledge
2016 Annual Meeting and Proxy Statement | 78
the nomination of any person, not made in compliance with our Bylaws. You may obtain a copy of our Bylaws by contacting our Corporate Secretary at West Pharmaceutical Services, Inc., 530 Herman O. West Drive, Exton, PA 19341.
Management is not aware of any other matters that will be presented at the 20162017 Annual Meeting, and our Bylaws do not allow proposals to be presented at the meeting unless they were properly presented to us before February 4, 2016. 3, 2017. However, if any other matter that requires a vote is properly presented at the meeting, the proxy holders will vote as recommended by the Board or, if no recommendation is given, in their own discretion.
2016 Annual Meeting and Proxy Statement | 79
68
VOTE BY INTERNET - www.proxyvote.com Use the Internet to transmit your voting instructions and for electronic delivery of information up until 11:59 P.M. Eastern Time the day before the cut-off date or meeting date. Have your proxy card in hand when you access the website and follow the instructions to obtain your records and to create an electronic voting instruction form. WEST PHARMACEUTICAL SERVICES, INC. C/O BROADRIDGE P.O. BOX 1342 BRENTWOOD, NY 1174211717 ELECTRONIC DELIVERY OF FUTURE PROXY MATERIALS If you would like to reduce the costs incurred by our company in mailing proxy materials, you can consent to receiving all future proxy statements, proxy cards and annual reports electronically via e-mail or the Internet. To sign up for electronic delivery, please follow the instructions above to vote using the Internet and, when prompted, indicate that you agree to receive or access proxy materials electronically in future years. VOTE BY PHONE - 1-800-690-6903 Use any touch-tone telephone to transmit your voting instructions up until 11:59 P.M. Eastern Time the day before the cut-off date or meeting date. Have your proxy card in hand when you call and then follow the instructions. VOTE BY MAIL Mark, sign and date your proxy card and return it in the postage-paid envelope we have provided or return it to Vote Processing, c/o Broadridge, 51 Mercedes Way, Edgewood, NY 11717. TO VOTE, MARK BLOCKS BELOW IN BLUE OR BLACK INK AS FOLLOWS: E00045-P73143E23657-P86201 KEEP THIS PORTION FOR YOUR RECORDS DETACH AND RETURN THIS PORTION ONLY THIS PROXY CARD IS VALID ONLY WHEN SIGNED AND DATED. WEST PHARMACEUTICAL SERVICES, INC. The Board of Directors recommends you vote FOR the following: For All Withhold All For All Except To withhold authority to vote for any individual nominee(s), mark “For All Except” and write the number(s) of the nominee(s) on the line below. WEST PHARMACEUTICAL SERVICES, INC.! ! ! 1. Election of Directors; Nominees: 01) Mark A. Buthman06) Myla P. Lai-Goldman 02) William F. Feehery07) Douglas A. Michels 03) Eric M. Green 08) Paolo Pucci 04) Thomas W. Hofmann09) John H. Weiland 05) Paula A. Johnson 10) Patrick J. Zenner The Board of Directors recommends you vote FOR the following: For Withhold For All AllAllExcept ! !! 1. Election of Directors; Nominees: 01) 02) 03) 04) 05) Mark A. Buthman06) Myla P. Lai-Goldman William F. Feehery07) Douglas A. Michels Eric M. Green 08) John H. Weiland Thomas W. Hofmann09) Patrick J. Zenner Paula A. Johnsonproposals 2 and 4 and recommends that an advisory vote on executive compensation be held on an annual basis. For Against Abstain The Board of Directors recommends you vote FOR the following proposals:For Against Abstain ! 2 Years ! 3 Years ! ! ! !Abstain ! ! ! 2. Advisory vote to approve named executive officer compensation; 3. Approval of adoption of the West Pharmaceutical Services, Inc. 2016 Omnibus Incentive Compensation Plan; and 1 Year 4. To ratify the appointment of PricewaterhouseCoopers LLP as our independent registered public accounting firm for the 20162017 year. ! ! ! ! NOTE: Such other business as may properly come before the meeting or any adjournment thereof. 3. Advisory vote on the frequency of the executive compensation vote; and Please sign exactly as your name(s) appear(s) hereon. When signing as attorney, executor, administrator, or other fiduciary, please give full title as such. Joint owners should each sign personally. All holders must sign. If a corporation or partnership, please sign in full corporate or partnership name by authorized officer. Signature [PLEASE SIGN WITHIN BOX] Date Signature (Joint Owners) Date V.1.1  
Important Notice Regarding the Availability of Proxy Materials for the Annual Meeting: The Notice and Proxy Statement and Annual Report are available at www.proxyvote.com. E00046-P73143E23658-P86201 WEST PHARMACEUTICAL SERVICES, INC. 530 Herman O. West Drive Exton, Pennsylvania 19341 This proxy is solicited by the Board of Directors The undersigned hereby appoints George L. Miller and Ryan M. Metz as Proxies, each with the power to appoint his substitute, and hereby authorizes them to represent and to vote, as designated on the reverse side, all the shares of common stock of West Pharmaceutical Services, Inc., held of record by the undersigned on March 8, 2016,7, 2017, at the Annual Meeting of Shareholders to be held on May 3, 20162, 2017 or any postponement or adjournment thereof. This Proxy, when properly executed, will be voted in the manner directed herein by the undersigned shareholder. If no direction is made, this Proxy will be voted FOR Proposals 1, 2 3 and 4.4 and FOR an annual advisory vote on executive compensation. Continued and to be signed on reverse side V.1.1  
| | |